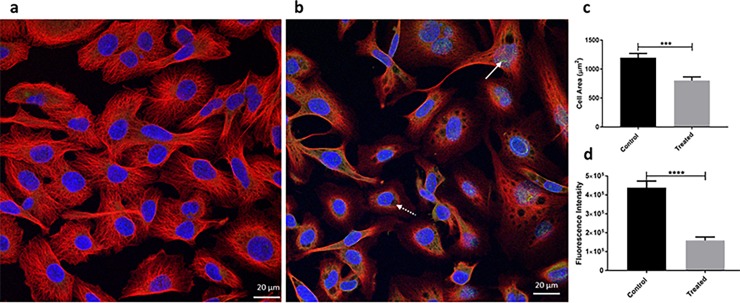
Fig 3. Immunocytochemistry.
(a) Control cells; (b) EgKI-1 treated MDA-MB-231 breast cancer cells 24 hours post-treatment. White arrow shows the green in treated cells indicating the EgKI-1 protein; White dotted arrow indicates the vacuole in the cell; Red indicates tubulin in cytoplasm; Blue, DAPI nuclear stain; (c) Cell area reduction (p<0.001***) and (d) Red fluorescence intensity of tubulin (p<0.0001****) after analysis by Student’s t-test.

