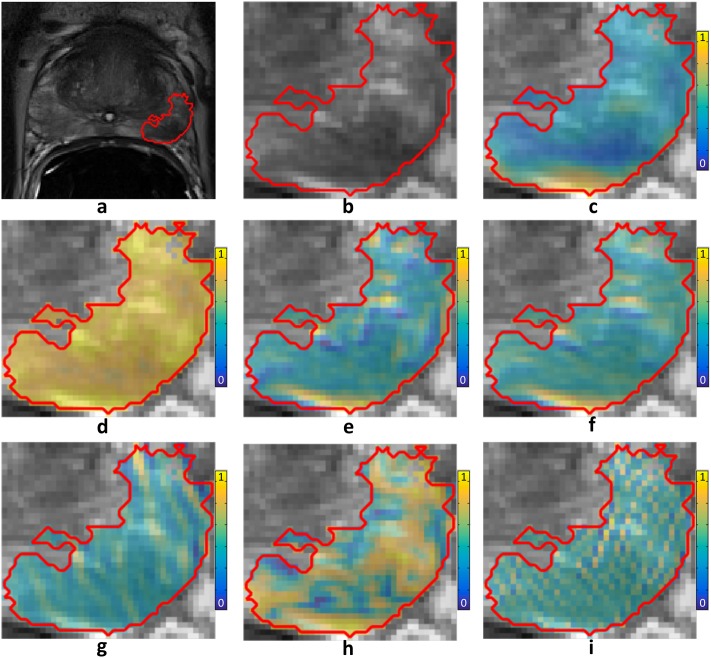
Fig 2.
(a) A T2w MRI of the prostate (tumor outlined in red). (b) Zoomed-in view of tumor. Sample radiomics feature maps from each class of radiomic features are plotted (blue = low, yellow = high). (c) Standard deviation within 9x9 windows. (d) Entropy within 5x5 windows. (e) Sobel yx filter. (f) Kirsch 1 filter. (g) Gabor cosine filter at an angle of and wavelength 4. (h) Haralick correlation within 5x5 windows. (i) Laws 5x5 spot-ripple filter.

