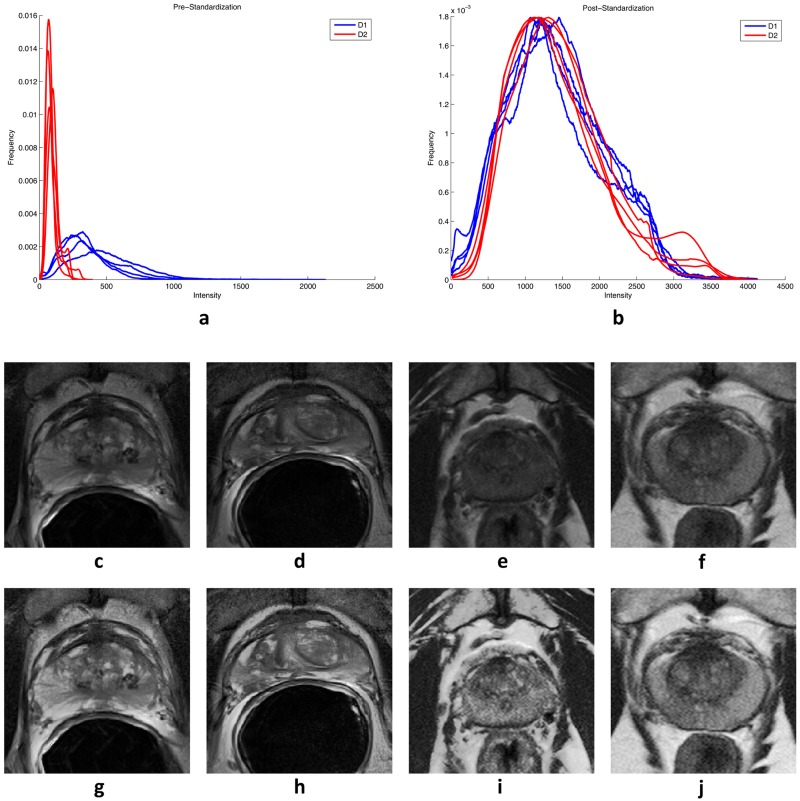
Fig 3.
(a) T2w MRI intensity distributions prior to standardization for four patients from D1 (blue) vs. four patients D2 (red), demonstrating poor inter- and intra-institutional alignment between intensity distributions of different patients. (b) After standardization to a template constructed from D1, the intensity distributions demonstrate better alignment. (c-f) Sample T2w MRI images pre-standardization and (g-j) post-standardization for (c,d,g,h) two patients from D1 and (e,f,i,j) two patients from D2.

