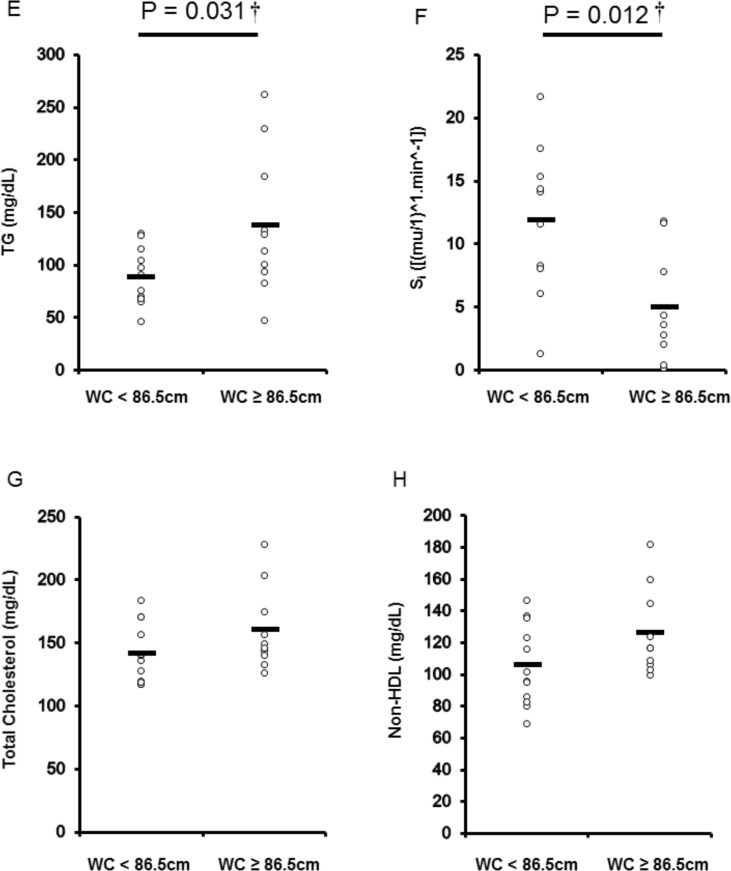
Fig 3. Differences in cardiometabolic disease risk biomarkers [triglycerides (TG) (E), insulin sensitivity (Si) (F), total cholesterol (G), Non-HDL (H) among participants dichotomized per the derived supine waist circumference cutoff for central adiposity (< 86.5cm, n = 12; ≥ 86.5cm, n = 10).
P values are shown for significant differences (P < 0.05).

