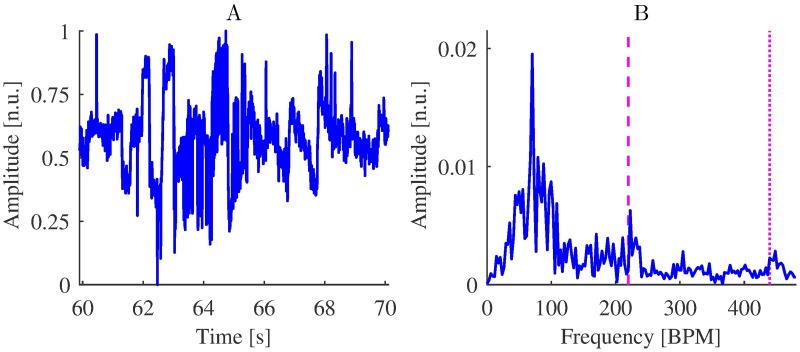
Fig 9. iPPG extraction from near-infrared video.
(A) Raw iPPG extracted from the video of Session 9 (compare with Fig 4A) and (B) amplitude spectrum densities of the iPPG signal 55-75 s (compare with Fig 3). The frequencies corresponding to the refPR value and its second harmonic are indicated by dashed and dotted lines, respectively. While the peak corresponding to the pulse rate is distinguishable, the signal is strongly contaminated with noise that hampers correct pulse rate estimation.

