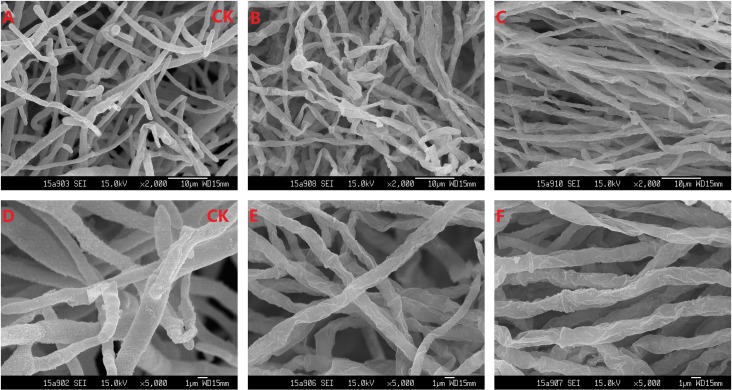
Fig 8. SEM micrographs of M. grisea mycelia.
The concentration of iturin A and bacillomycin F were 62.50 and 125.00 μg/mL, respectively. A and D: mycelia treated without CLPs; B and E: mycelia treated with iturin A; C and F: mycelia treated with bacillomycin F. A, B and C at 2000-fold magnification; D, E and F at 5000-fold magnification.

