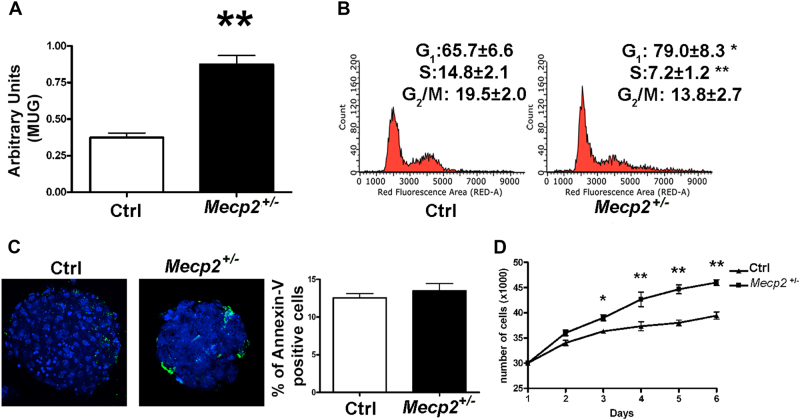
Fig. 1. Cell growth, senescence, and apoptosis assays on Mecp2+/− and control NSCs.
a Senescence evaluation was performed with the MUG assay. The data are expressed as arbitrary units (±SD, n = 5 biological replicates, **p < 0.01). b Cell cycle analysis. The picture shows the cell cycle profiles of mutated and control NSCs (±SD, n = 5 biological replicates, *p < 0.05, **p < 0.01). c Annexin V assay to detect apoptotic cells. Representative photomicrographs of apoptotic cells stained with Annexin V (green). Nuclei were counterstained with Hoechst 33342 (blue). Graph shows mean expression values in Mecp2+/− and control samples (±SD, n = 5 biological replicates). d Cell proliferation was determined with a Quick Cell Proliferation Assay Kit II. Cells were seeded in 96-well culture plates. At 2, 3, 4, 5, and 8 days post plating, the cells were collected and counted (±SD, n = 5 biological replicates, *p < 0.05, **p < 0.01)

