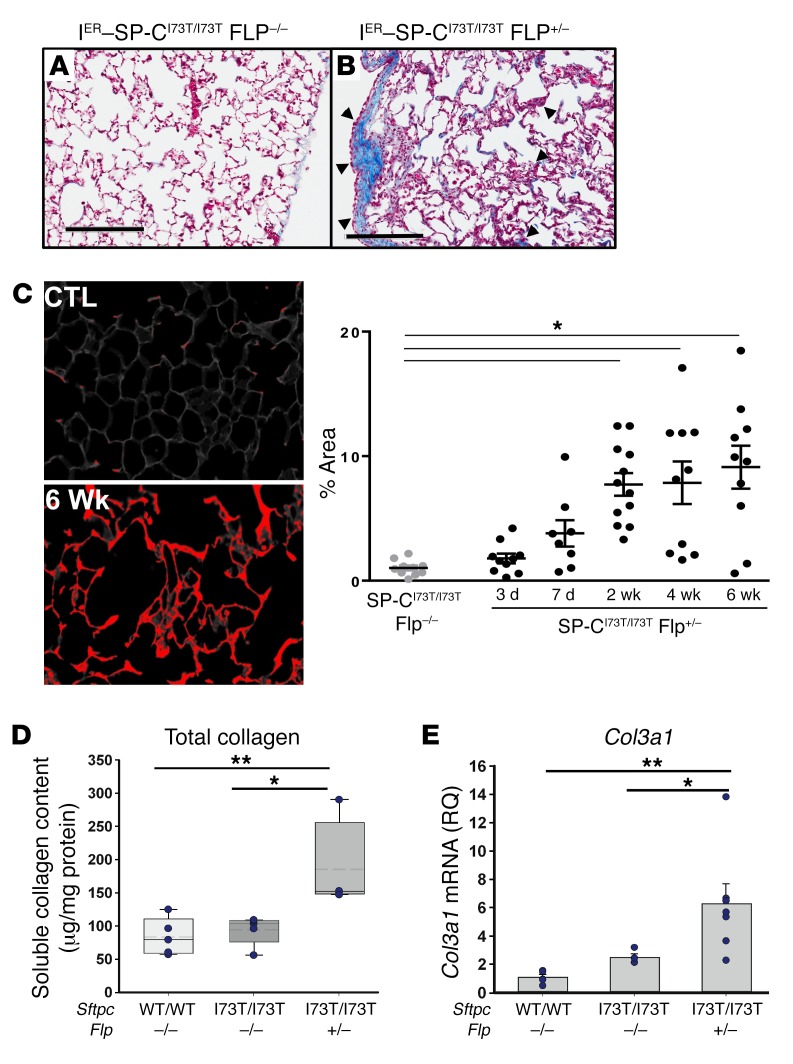
Figure 6. SftpcI73T expression in AT2 cells increases lung collagen content.
Histological sections, homogenates, and RNA were prepared from lungs of IER-SP-CI73T/I73TFlp+/– mice and IER-SP-CI73T/I73TFlp–/– controls 6 weeks after 300 mg /kg tamoxifen. (A and B) Representative trichrome staining showing focal collagen deposition (blue) in both subpleural and parenchymal areas (arrowheads) of IER-SP-CI73T/I73TFlp+/– mice. Scale bars: 300 μm. (C) Representative Picrosirius red stained field from IER-SP-CI73T/I73TFlp+/– and IER-SP-CI73T/I73TFlp–/– (CTL) mice with quantitation performed using ImageJ. Data represent percentage of total section area, with dot plots and mean ± SEM shown. *P < 0.05 versus ER-SP-CI73T/I73TFlp+/– by One-way ANOVA with Tukey’s post hoc test. Scale bars: 50 μm (left), 20 μm (right). (D) Soluble collagen in left lung homogenates measured by Sircol assay. Shown are dot plots with mean ± SEM. The x axis depicts groups by Sftpc allele and Flp allele status. *P = 0.022 for IER-SP-CI73T/I73TFlp+/– versus IER-SP-CI73T/I73TFlp–/– and **P = 0.011 versus untreated WT (WT/WT) group by 1-way ANOVA with Tukey’s post hoc test. (E) The relative quantity (RQ) of Col3a1 mRNA was determined by qRT-PCR and expressed as fold change from untreated WT animals (WT/WT) (mean RQ = 1). x axis depicts groups by Sftpc and Flp allele status. Bar graphs with superimposed dot plots with mean ± SEM are shown. *P = 0.032 for IER-SP-CI73T/I73TFlp+/– versus IER-SP-CI73T/I73TFlp–/–; **P = 0.010 versus WT/WT by 1-way ANOVA with Tukey’s post hoc test.

