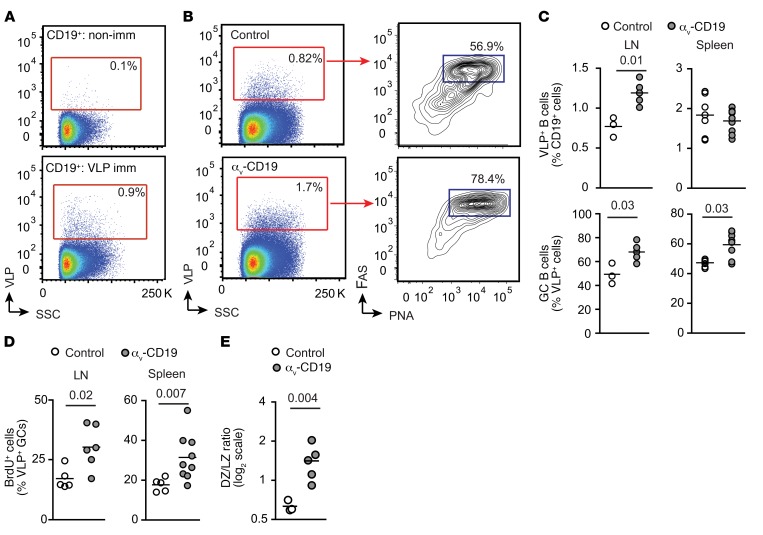
Figure 2. Increased GC B cells in αv-CD19 mice immunized with TLR ligands.
(A) FACS plots of cells from LNs from VLP-immunized and nonimmunized (non-imm) mice stained with fluorescent VLPs, showing VLP+ cells in CD19+ gate. Gating strategy for VLP-specific B cells based on nonimmunized mice is shown. SSC, side scatter. (B) Representative FACS analysis of VLP+ cells from mediastinal and abdominal LNs of control and αv-CD19 mice 14 days after immunization with 2 μg VLPs. Left panels show on CD19+ cells and gates used to identify VLP+ cells. Right panels show GC B cells (PNA+FAS+ cells) within the CD19+VLP+ gate. (C) Quantification of VLP+ cells and VLP+ GC cells in VLP-immunized control and αv-CD19 mice. Each point represents a single mouse; bars show mean. (D) Proportion of LN and spleen VLP+ GC B cells (gated as in B) from control and αv-CD19 mice immunized with 2 μg VLP for 14 days that stain positive for BrdU 12 hours after BrdU administration. (E) VLP-specific GC cells were gated based on expression of markers of DZ (CXCR4+CD86lo) and light zone (LZ) (CD86+CXCR4lo). Data show ratio of DZ/light zone cells in individual mice. Bars show the mean. In all cases, P values of less than 0.05 are shown (Mann-Whitney-Wilcoxon test). For all data shown, similar results were seen in at least 3 independent experiments.

