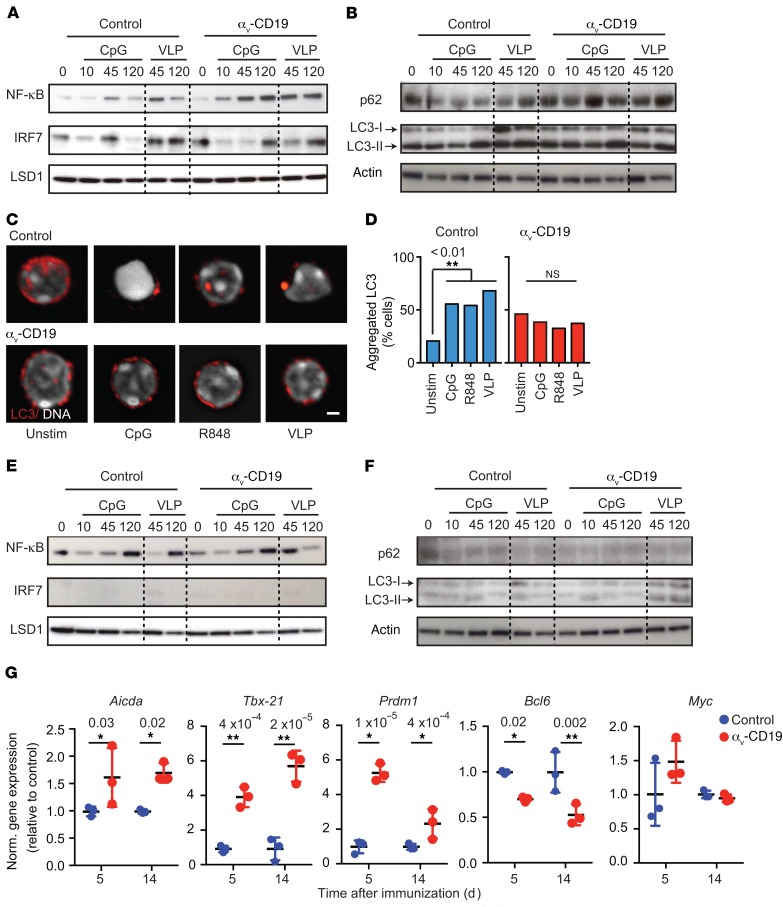
Figure 4. αv Regulates TLR signaling in GC B cells through autophagy proteins.
(A and B) GC B cells were sorted from spleens of αv-CD19 and control mice 14 days after immunization with VLP and restimulated in vitro with CpG DNA or VLP for the indicated times (minutes). Western blots show NF-κB p65 and IRF7 in nuclear fractions (A) or p62 and LC3b in whole-cell lysates (B). Also shown is staining of LSD1 or actin to confirm equivalent protein loading in nuclear fraction and whole-cell lysates, respectively. These were performed on the same blot, except in the case of LC3-II, for which actin staining was from aliquots of the same samples run on parallel gels contemporaneously. (C) Confocal images of sorted primary GC B cells (as in A and B) treated with CpG DNA, R848, or VLP for 2 hours and stained for LC3 and Hoescht. Scale bar: 2.9 µm. (D) Quantification of LC3 reorganization after stimulation with indicated TLR ligands. Data are based on analysis of at least 30 cells/condition. P values of less than 0.01 are shown (Pearson’s χ2 test). *P < 0.05. (E and F) FACS-sorted non-GC follicular B cells from spleens of VLP-immunized αv-CD19 and control mice analyzed as in A and B. (G) Expression of indicated genes measured by quantitative reverse-transcriptase PCR (QRT-PCR) in RNA from FACS-sorted VLP-specific GC cells, isolated 5 or 14 days after immunization with 2 μg VLPs. Data from individual mice are shown, with mean ± SD. P values of less than 0.05 are shown (2-tailed Student’s t test). *P < 0.05; **P < 0.005. Data are all from 1 representative experiment of at least 3 independent experiments (2 experiments for p62 blots) in which similar results were seen.

