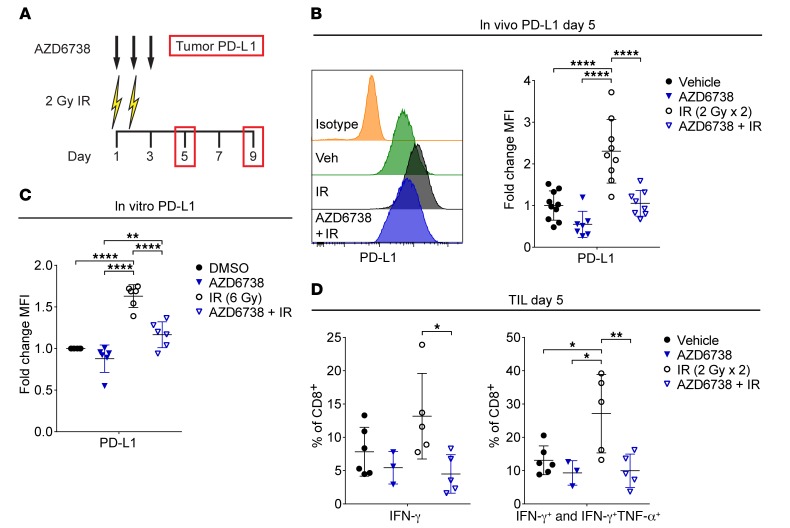
Figure 3. AZD6738 attenuates radiation-induced PD-L1 expression in CT26 tumors.
(A) Schematic showing schedules of IR, AZD6738, and time points for tumor PD-L1 expression analyses. Dose and time of administration of AZD6738 were the same as in Figure 1. (B) Representative histograms of PD-L1 expression on CT26 tumor cells at day 5 for the designated treatments and isotype control, and corresponding quantitation of the fold change in PD-L1 median fluorescence intensity (MFI) relative to the average MFI of vehicle controls (within a given experiment). Data from 4 independent experiments (3 for AZD6738), each with 1–4 mice per arm. n = 10 vehicle, 7 AZD6738, 9 IR, 8 AZD6738 + IR. (C) Quantitation of fold change in PD-L1 MFI following treatment in vitro with AZD6738 (300 nM), 6 Gy IR, AZD6738 plus IR, or DMSO control. Data represent 6 independent biological replicates. (D) Quantitation of the percentage of tumor-infiltrating CD8+ T cells expressing IFN-γ or IFN-γ and TNF-α following stimulation with PMA/ionomycin at day 5. Data from 3 independent experiments (1 for AZD6738), each with 1–3 mice per arm. n = 6 vehicle, 3 AZD6738, 5 IR, 5 AZD6738 + IR. (B–D) Mean and SD bars shown. *P < 0.05, **P < 0.01, ****P < 0.0001, ANOVA with Tukey’s multiple-comparisons test. Brackets not shown for comparisons that were not statistically significant.

