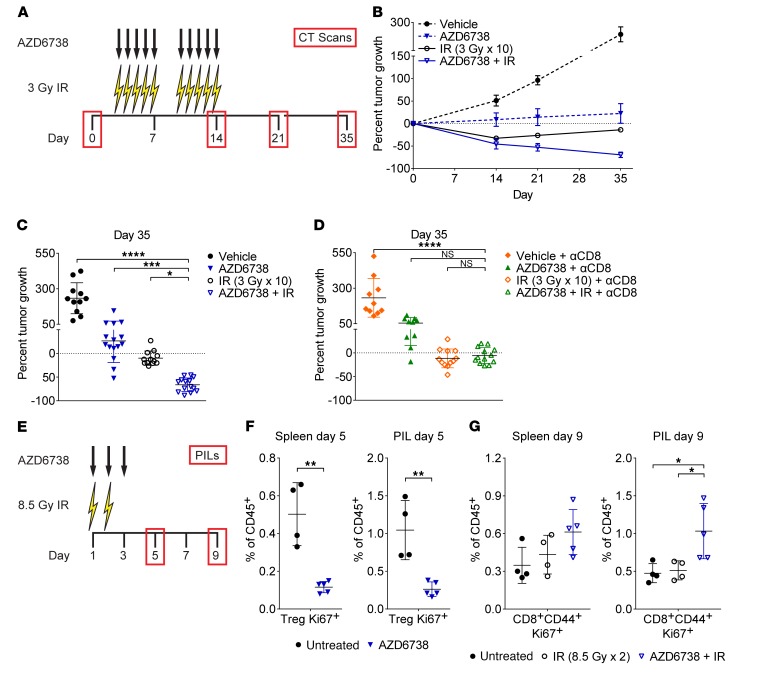
Figure 8. AZD6738 plus radiation generates a CD8+ T cell–dependent response in KrasG12D/Twist1 lung adenocarcinoma.
(A) Schematic showing schedules of hemithoracic radiation (IR), AZD6738, and micro-CT scans. (B) Response of lung tumors over time. Data represent mean percentage tumor volume change from day 0 (± SEM). n (tumors/mice) = 7/3 vehicle, 8/4 AZD6738, 9/4 IR, 7/4 AZD6738 + IR (5/3 day 21). (C) Percent tumor volume change at day 35. n (tumors/mice) = 11/5 vehicle, 15/7 AZD6738, 12/6 IR, 14/8 AZD6738 + IR. (D) Percent tumor volume change at day 35 in CD8-depleted mice (250 μg anti-CD8 antibody [αCD8] administered days 3, 6, 10, and 13). n (tumors/mice) = 10/4 vehicle + αCD8, 10/5 AZD6738 + αCD8, 12/6 IR + αCD8, 13/6 AZD6738 + IR + αCD8. (C and D) Mean and SD bars shown. *P < 0.05, ***P < 0.001, ****P < 0.0001, ANOVA with Holm-Šidák multiple-comparisons test. Statistical significance shown only for comparisons with AZD6738 + IR (C) or AZD6738 + αCD8 + IR (D). (E) Schematic showing schedules of hemithoracic IR, AZD6738, and pulmonary-infiltrating lymphocyte (PIL) profiling. (F) Quantitation of splenic and PIL proliferating (Ki67+) Tregs at day 5 following AZD6738 treatment, compared with untreated control. (G) Quantitation of splenic and PIL proliferating (Ki67+) CD8+CD44+ T cells at day 9 following treatment with IR or AZD6738 plus IR, compared with untreated control. (F and G) Data from 1 (IR/AZD6738 + IR, day 9 only), 2 (AZD6738, day 5 only), or 3 (untreated) independent experiments, with 1–5 mice per arm per experiment. n = 4 untreated, 5 AZD6738, 4 IR, 5 AZD6738 + IR. Mean and SD bars shown. (F) **P < 0.01, unpaired, 2-tailed t test. (G) *P < 0.05, ANOVA with Tukey’s multiple-comparisons test. Brackets not shown for comparisons that were not statistically significant.

