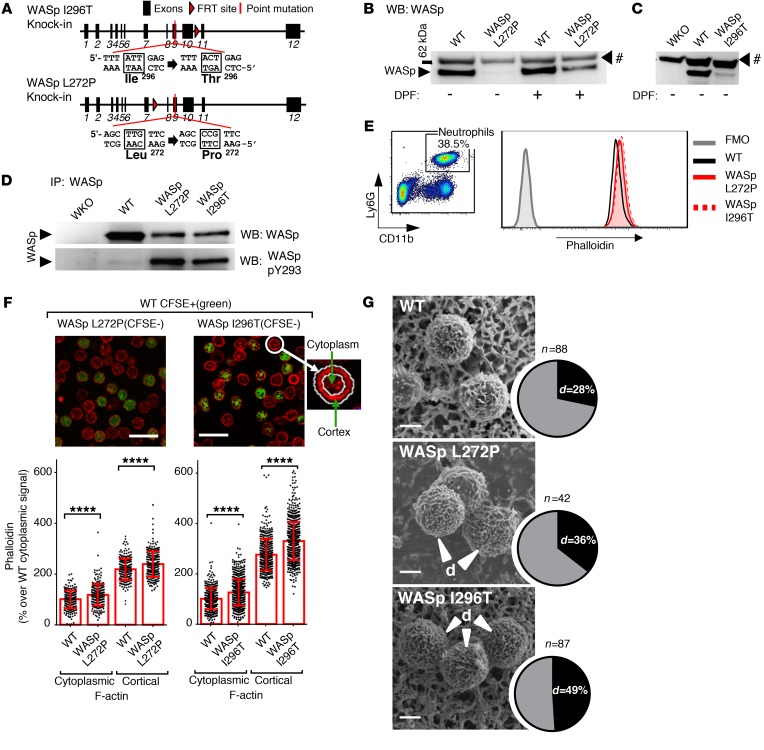
Figure 3. Increased polymerized actin, WASp Y293 phosphorylation, decreased WASp stability, and altered surface topography in mouse models of XLN.
(A) Genomic organization, locations, and sequences of the introduced I296T and L272P mutations in the mouse WASp gene. (B and C) Protein expression of WASp in lysates of WT, WASp L272P, WASp I296T, and WASp-KO (WKO) peritoneal neutrophils with or without pretreatment of cells with DPF. WASp was detected by Western blotting (WB). #, unknown protein. n = 3 experiments. (D) Protein expression (upper panel) and Y293 phosphorylation (lower panel) of WASp in WKO, WT, WASp L272P, and WASp I296T in immunoprecipitated protein lysates of bone marrow neutrophils. n = 3 experiments. (E) FACS plot of Ly6G+CD11b+ neutrophils in mouse peripheral blood. F-actin content of neutrophils was measured with fluorescently labeled phalloidin and flow cytometry. A representative image of 3 individual blood samples per genotype is shown. (F) Quantitative analysis of cortical and cytoplasmic F-actin, labeled with phalloidin (red), in bone marrow neutrophils. Outlines of cells were recognized by Fiji software and the cortex defined by a ring encompassing the outline. Integrated fluorescent intensity in the ring area and within the ring were measured, and values from individual cells were plotted. CFSE labeling (for all genotypes both labeled and unlabeled samples) was used to differentiate between genotypes in each individual field. Data were normalized for the average of WT cytoplasmic signal (100%). Scale bars: 20 μM. WASp I296T (n = 752) vs. WT (n = 482); WASp L272P (n = 256) vs. WT (n = 231). Data are shown as mean ± SD. Unpaired, 2-tailed Student’s t test. (G) Surface structure of WT, WASp L272P, and WASp I296T neutrophils. Cells were isolated from bone marrow, fixed in paraformaldehyde, and photographed with scanning electron microscopy. The percentages of cells with dense surface ruffles (d) were counted manually. Scale bars: 2 μM. ****P < 0.0001.

