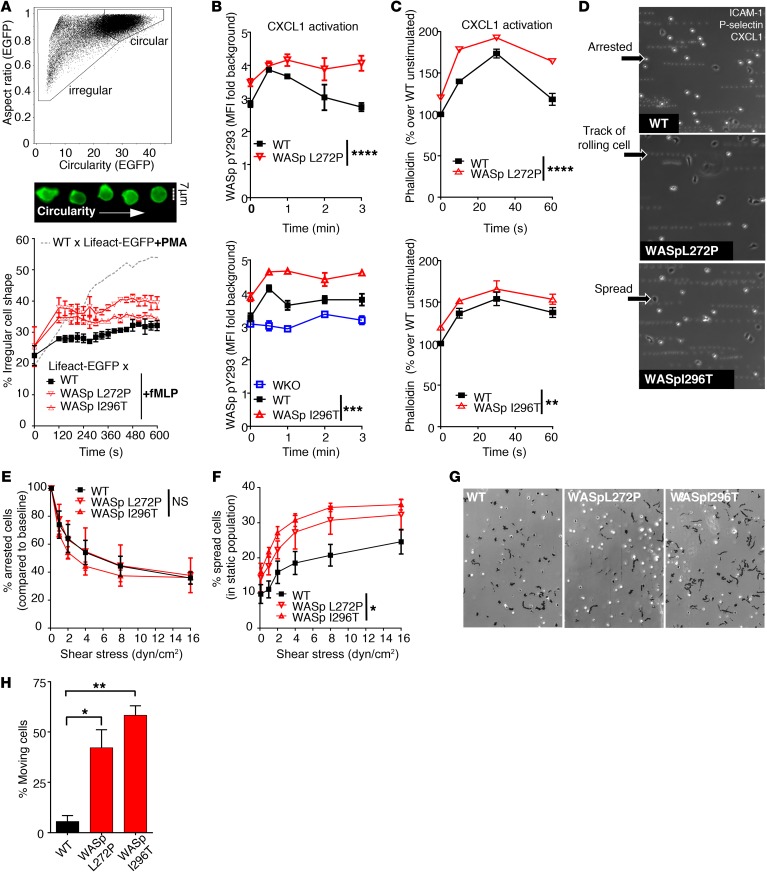
Figure 5. Increased actin dynamics and spreading on ICAM-1 in WASp XLN neutrophils.
(A) Live-cell actin kinetics after neutrophil activation with fMLP was quantified by imaging flow cytometry. Plot of circularity and aspect ratio (upper panel) was calculated on EGFP images. Sample images (middle panel) show WT × Lifeact-EGFP cells with increasing circularity. Ratio of irregularly (GFP [aspect ratio]lo GFP[circularity]lo) shaped cells as a function of time (lower panel). Kinetics was calculated after binning data to 30-second time frames. Less than 15,000 cells/each genotype; 2 independent experiments per genotype. (B) Kinetics of WASp Y293 phosphorylation upon CXCL1 treatment was quantified with imaging flow cytometry after intracellular staining of phospho-Y293 WASp. Phospho-Y293 WASp signal was depicted as fold change of pY293 integrated intensity over background (secondary antibody staining only). n = 3 replicates, n = 4 experiments. (C) Kinetics of F-actin polymerization upon CXCL1 treatment was quantified with phalloidin staining and flow cytometry. n = 3 replicates, n = 3 experiments. (D) rmP-selectin–, rmICAM-1–, and rmCXCL-1–coated plastic flow chambers were perfused with bone marrow neutrophils at 0.1 dyn/cm2. Representative images were taken after increasing flow rate to 2 dyn/cm2. Motility was assessed by overlaying 10 consecutive frames. (E) Number of arrested cells were counted and depicted as percentage of arrested cells at 0.1 dyn/cm2 after increasing flow rate stepwise with 30 seconds of run at each indicated sheer stress. n = 3 replicates, n = 3 experiments. (F) Ratio of spread cells at increasing flow rate. (G) Neutrophils in rmP-selectin–, rmICAM-1–, and rmCXCL-1–coated plastic flow chambers at 2 dyn/cm2 shear stress. Black tracks indicate the motility of adherent cells within a 20-minute time period. n = 3 images/genotype. Data are represented as mean ± SEM. One-way (H) or 2-way ANOVA (B, C, E, F) and Bonferroni’s multiple comparison test were used statistical significance. *P < 0.05; **P < 0.01; ***P < 0.001; ****P < 0.0001. Original magnification: ×100 (D and G).

