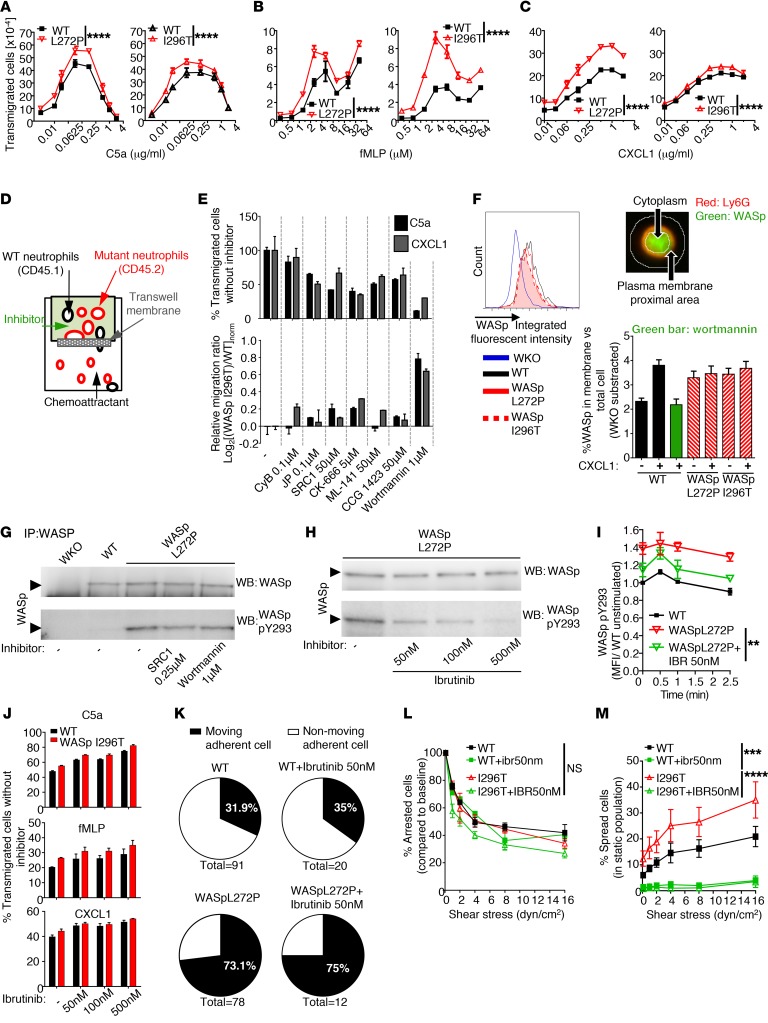
Figure 6. Increased in vitro migration, membrane translocation, and Btk-dependent phosphorylation of WASp in XLN neutrophils.
(A–C) Migration of WT vs. WASp L272P and WASp I296T bone marrow neutrophils toward the indicated chemoattractants in Transwell plates. Measured with flow cytometry. n = 3 replicates, n = 3 experiments/chemoattractant. (D and E) WT (CD45.1) and WASp XLN (CD45.2) neutrophils were mixed at a 1:1 ratio in the upper well of a Transwell plate and incubated for 10 minutes with inhibitors. Migration rate toward C5a or CXCL1 was plotted. n = 2 experiments. (F) WASp intracellular expression was measured by imaging flow cytometry. Ratios of plasma membrane proximal (determined by Ly6G surface staining) WASp and WASp in the total cell was plotted. Data are shown as mean + SEM of at least 198 neutrophils. n = 3 experiments. (G) WASp and phospho-Y293 WASp in SRC1- and Wortmannin-pretreated neutrophils were measured by Western blot. n = 2. (H) WASp and phospho-Y293 WASp in WASp L272P neutrophils before and after ibrutinib treatment. n = 3. (I) WASp Y293 phosphorylation upon CXCL1 activation with or without ibrutinib treatment (flow cytometry). n = 3. (J) Transwell migration of WT and WASp I296T neutrophils toward C5a (0.125 μg/ml), fMLP (3 μM), and CXCL1 (0.25 μg/ml) after incubation with ibrutinib. n = 3. (K) Ratio of motile cells among adherent cells on rmP-selectin, rmICAM-1, and rmCXCL-1 under flow as in Figure 5G. (L) Numbers of arrested cells as percentages of arrested cells at 0.1 dyn/cm2 as in Figure 5E. (M) Ratio of spread cells at increasing flow rate as in Figure 5F. n = 3 replicates, n = 2 experiments. Data are represented as mean ± SEM. Two-way ANOVA was used for statistical significance. **P < 0.01; ***P < 0.001; ****P < 0.0001.

