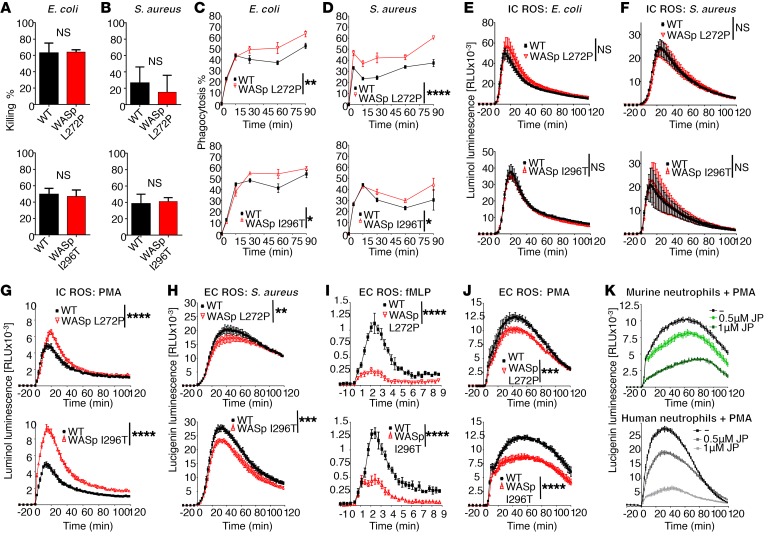
Figure 7. Increased phagocytosis rate, normal killing of bacteria, and dysregulated ROS responses in XLN neutrophils.
E. coli (A) and S.aureus (B) killing capacity of WT and WASp XLN neutrophils were assessed by coincubating serum-opsonized bacteria and neutrophils at a ratio of 1:5 (E. coli/neutrophil) for 60 minutes (A) or 1:1 (S.aureus/neutrophil) for 60 and 90 minutes as shown in upper and lower panels, respectively (B). n = 3 replicates, n = 3 experiments with each bacteria. (C and D) Phagocytosis of Alexa Fluor 488–labeled, serum-opsonized E. coli (C) and S. aureus (D) by WT WASp XLN neutrophils measured by flow cytometry. n = 3 replicates, n = 3 experiments with each bacteria. (E–G) Intracellular ROS (IC ROS) measured with luminol chemiluminescence in murine bone marrow neutrophils upon stimulation with E. coli (n = 8) (E), S.aureus (n = 10) (F), or PMA (n = 18). n = 4. Data are shown as mean ± SD, 2-way ANOVA. (H–J) Extracellular ROS (EC ROS) was measured using a lucigenin chemiluminescence assay in murine bone marrow neutrophils upon stimulation with (H) heat-killed serum-opsonized S. aureus (n = 18), (I) fMLP (n = 4), or (J) PMA (n = 26). n = 4. Data are shown as mean ± SD. Two-way ANOVA. (K) Extracellular ROS was measured upon PMA stimulation of murine (upper panel) and human healthy donor (lower panel) neutrophils with or without pretreatment with jasplakinolide. n = 5. Data are shown as mean ± SD. *P < 0.05; **P < 0.01; ***P < 0.001; ****P < 0.0001.

