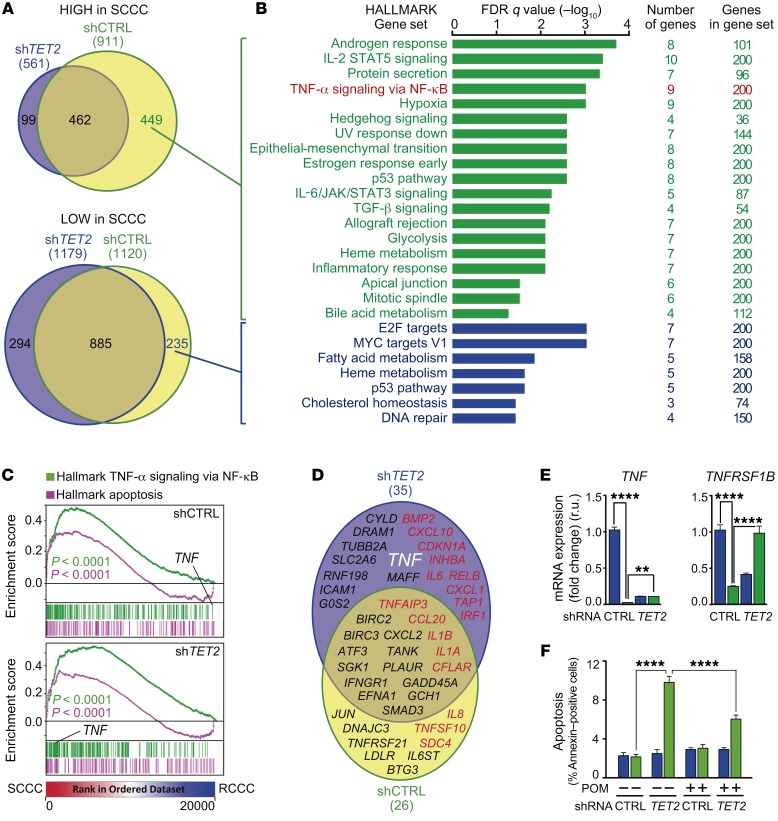
Figure 10. TET2 controls SCCC survival by modulating TNF-α signaling.
(A) Venn diagrams comparing genes highly (top) or lowly (bottom) expressed in SCCCs versus RCCCs isolated from the indicated cell lines. (B) Gene ontology analyses of TET2-induced (green) and TET2-repressed (blue) genes in SCCCs versus RCCCs. (C) GSEA plots showing enrichment of the indicated gene sets in SCCC versus RCCC expression profiles from the indicated cell lines. 1-way ANOVA P value. (D) Genes related to apoptosis were selected from the Molecular Signatures Database (Broad Institute). Venn diagram showing genes related to apoptosis and highly expressed in SCCCs versus RCCCs from the indicated cell lines. Proapoptotic (red) and antiapoptotic (black) genes are shown. The gene of interest is indicated in white (TNF). (E) Expression of the indicated genes was measured by qPCR. TNF mRNA measurements: shCTRL RCCC vs. shTET2 RCCC/SCCC (P ≤ 0.0001); shCTRL SCCC vs. shTET2 RCCC (P ≤ 0.01). TNFRSF1B mRNA measurements: shCTRL RCCC vs. shTET2 RCCC (P ≤ 0.0001); shCTRL SCCC vs. shTET2 RCCC (P ≤ 0.05); shTET2 RCCC vs. shTET2 SCCC (P ≤ 0.0001). (F) Evaluation of apoptosis by flow cytometry in RCCCs and SCCCs of the indicated cell lines after vehicle or pomalidomide (POM) treatment. Apoptosis measurements: shCTRL SCCC/RCCC VEH vs. shTET2 SCCC VEH/POM (P ≤ 0.0001); shTET2 RCCC VEH vs. shTET2 VEH/POM SCCC (P ≤ 0.0001); shTET2 SCCC VEH vs. shCTRL/shTET2 RCCC/SCCC POM (P ≤ 0.0001); shCTRL RCCC/SCCC POM vs. shTET2 SCCC POM (P ≤ 0.0001); shTET2 RCCC POM vs. shTET2 SCCC POM (P ≤ 0.0001). (E and F) Blue bars, RCCCs; green bars, SCCCs. Data are represented as mean ± SD (E) or ± SEM (F) of triplicates from 3 independent experiments. 1-way ANOVA. **P ≤ 0.01; ****P ≤ 0.0001. All analyses were performed in the indicated SW1222-H2BeGFP cell lines growing as MTs.

