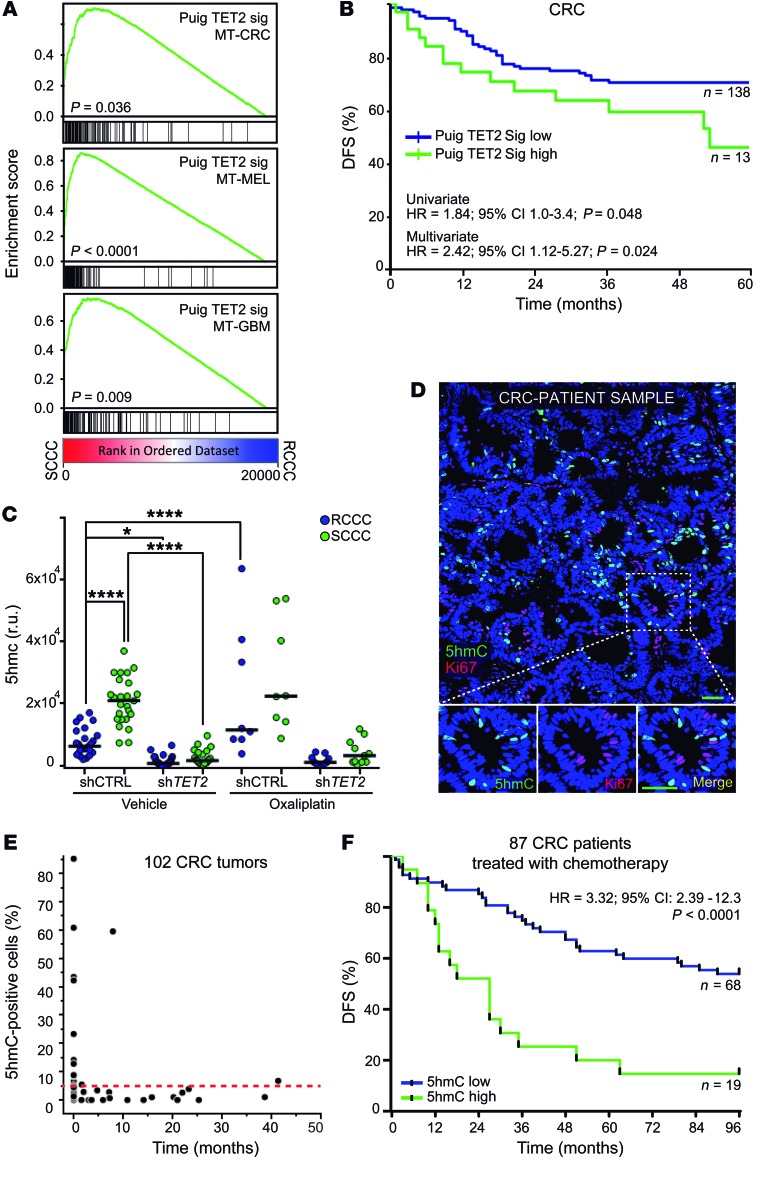
Figure 11. TET2/5hmC predicts shorter survival in CRC patients.
(A) GSEA plots showing enrichment of TET2 signature in SCCC versus RCCC expression profiles in the indicated models. 1-way ANOVA P value. (B) Disease-free survival (DFS) of chemo-treated high-risk stage II and stage III colon cancer patients (GSE39582, n = 151) according to TET2 signature score. (C) Histological quantification of 5hmC content in RCCCs and SCCCs per image from the indicated xenografts after vehicle or oxaliplatin treatments (n = 5 to 6 xenografts per group). Between 8 and 30 images per condition were evaluated. Data are represented as mean ± SEM. *P ≤ 0.05; ****P ≤ 0.0001, 1-way ANOVA. 5hmC measurements: shCTRL RCCC VEH vs. shCTRL SCCC OX (P ≤ 0.0001); shCTRL SCCC VEH vs. shTET2 RCCC/SCCC VEH/OX (P ≤ 0.0001); shTET2 RCCC/SCCC VEH vs. shCTRL RCCC/SCCC OX (P ≤ 0.0001); shCTRL RCCC/SCCC OX vs. shTET2 RCCC/SCCC OX (P ≤ 0.0001). (D) Immunofluorescence analysis of 5hmC and the proliferation marker (Ki67) in a colorectal cancer patient sample. Scale bar: 100 μm; high-magnification scale bar: 20 μm. (E) Dot plot correlating the percentage of 5hmC-positive versus Ki67-positive cells quantified by immunofluorescence and immunohistochemistry, respectively, in primary tumors (n = 55) and liver metastases (n = 47) from CRC patients. Red dashed line indicates the cutoff value above which a sample was considered high for 5hmC (5%). (F) DFS of chemo-treated CRC (Vall d’Hebron Institute of Oncology tissue microarray cohort, n = 87) patients. Tumors were considered 5hmC-high when at least 5% of tumor cells presented signal equal to or higher than that of adjacent stroma, and 5hmC-low when fewer than 5% of tumor cells did. Negative tumors did not show any detectable 5hmC signal in cancer cells. Negative tumors are included as 5hmC-low. (B and F) HR, hazard ratio. P values were calculated using Cox proportional hazards model.

