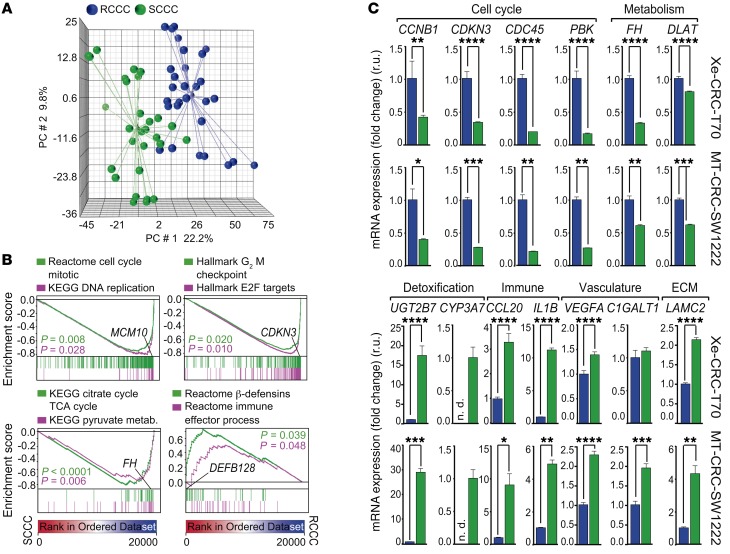
Figure 3. SCCCs show a distinctive gene expression profile.
Gene expression profiles were analyzed from 29 replicates of SCCCs and 29 paired RCCCs isolated from 3 different cancer types: colorectal, melanoma, and glioblastoma, grown as MTs or xenografts. (A) Principal component (PC) analysis showing microarray data. Light-colored spheres represent mean-derived centroids. (B) Gene set enrichment analysis (GSEA) plots showing enrichment of the indicated gene sets from all integrated cancer models. P values by 1-way ANOVA. (C) Differential expression evaluation of indicated genes by qPCR analysis in RCCCs (blue bars) and SCCCs (green bars). Data are represented as mean ± SD of triplicates from 3 independent experiments. n.d., not detected; r.u., relative units. *P ≤ 0.05; **P ≤ 0.01; ***P ≤ 0.001; ****P ≤ 0.0001, 2-tailed Student’s t test.

