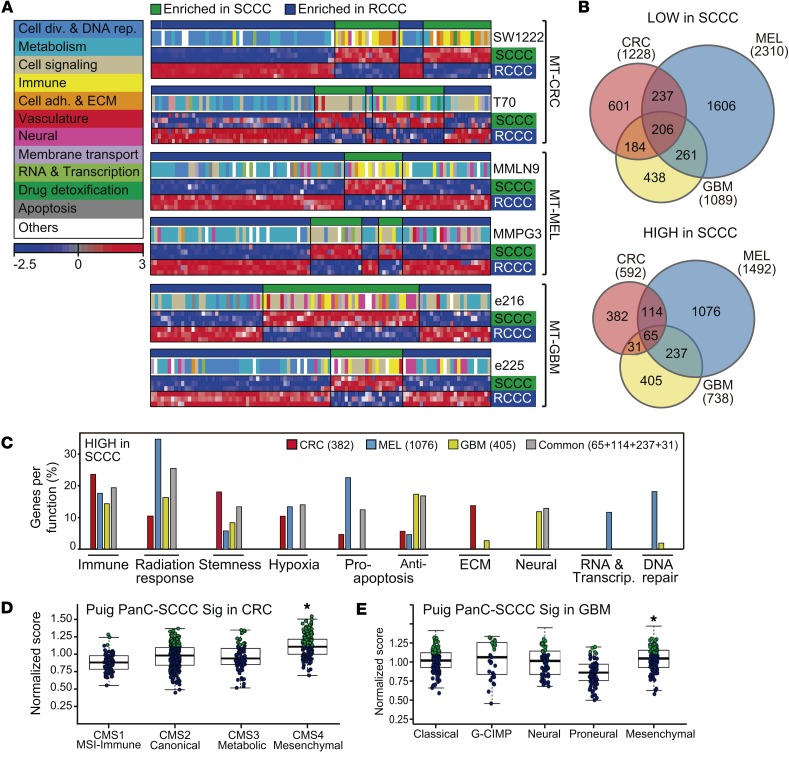
Figure 4. SCCC signature includes genes related to several biological functions.
(A) Single-sample GSEA projections for each indicated MT cancer model. Colored boxes correspond to general functions grouping differentially enriched gene sets. Color bar legend: blue, downregulated expression; red, upregulated expression. ECM, extracellular matrix. (B) Venn diagrams comparing genes lowly (top) or highly (bottom) expressed in SCCCs versus RCCCs. (C) Genes more highly expressed in SCCCs were grouped depending on their function following the Broad Institute’s ontology. Bars represent the percentage of genes related to a particular function with respect to all genes more highly expressed in SCCCs that are exclusive or common to models of each cancer type as defined in the Venn diagram shown in B, bottom. (D and E) Normalized PanC-SCCC signature score of The Cancer Genome Atlas (TCGA) CRC (D) and GBM (E) cohorts with intrinsic gene expression classifier labels. Significantly higher scores in the upper quartile are marked in green dots. *P < 0.001, Kruskal-Wallis test.

