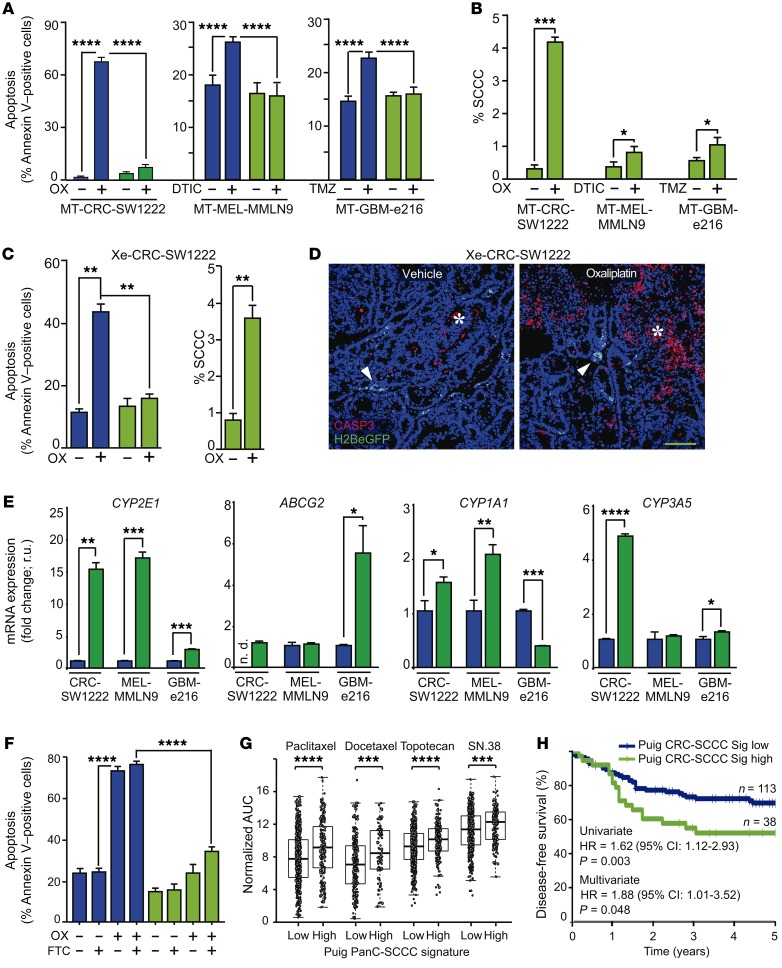
Figure 5. SCCCs present enhanced chemoresistance.
(A–D) Chemoresistance evaluation of SCCCs and RCCCs in indicated models. (A–C) Analysis of apoptosis (A and C) and proportion of SCCCs (B and C) after chemotherapy exposure. OX, oxaliplatin; DTIC, light-activated dacarbazine; TMZ, temozolomide. Apoptosis measurements: SW1222 RCCC vehicle (VEH) vs. SCCC OX (P ≤ 0.01); RCCC OX vs. SCCC VEH (P ≤ 0.0001); MMLN9 RCCC DTIC vs. SCCC VEH (P ≤ 0.0001); e216 RCCC TMZ vs. SCCC VEH (P ≤ 0.0001). (D) Immunofluorescence of caspase-3 (CASP3) (n = 6 per group) treated or not treated with oxaliplatin. Arrowheads, SCCCs; asterisk, apoptotic areas. Scale bar: 100 μm. (E) qPCR of indicated genes. Data are represented as mean ± SD of triplicates. ND, not detected; r.u., relative units. (F) Apoptosis flow cytometric evaluation in RCCCs and SCCCs from CRC-SW1222-H2BeGFP cells growing as MTs. FTC, fumitremorgin C. Apoptosis measurements: RCCC VEH/FTC vs. RCCC OX/OX+FTC (P ≤ 0.0001); RCCC VEH/FTC vs. SCCC VEH/FTC (P ≤ 0.01); RCCC VEH/FTC vs. SCCC OX+FTC (P ≤ 0.001); RCCC OX/OX+FTC vs. SCCC VEH/FTC/OX/OX+FTC (P ≤ 0.0001); SCCC VEH/FTC vs. SCCC OX+FTC (P ≤ 0.0001); SCCC OX vs. SCCC OX+FTC (P ≤ 0.001). (G) Drug sensitivity of cancer cell lines according to PanC-SCCC signature scores. Adjusted Wilcoxon test. (H) Disease-free survival of chemo-treated high-risk stage II/III colon cancer patients (GSE39582, n = 151) according to CRC-SCCC signature score. HR, hazard ratio. Cox proportional hazards model. (A–C and F) Data are represented as mean ± SEM. (A, B, E, and F) Data were obtained from triplicates of 3 independent experiments. (A–C, E, and F) Blue bars, RCCCs; green bars, SCCCs. (A and F) 1-way ANOVA. (B, C, and E) 2-tailed Student’s t test. (A–C and E–G) *P ≤ 0.05; **P ≤ 0.01; ***P ≤ 0.001; ****P ≤ 0.0001.

