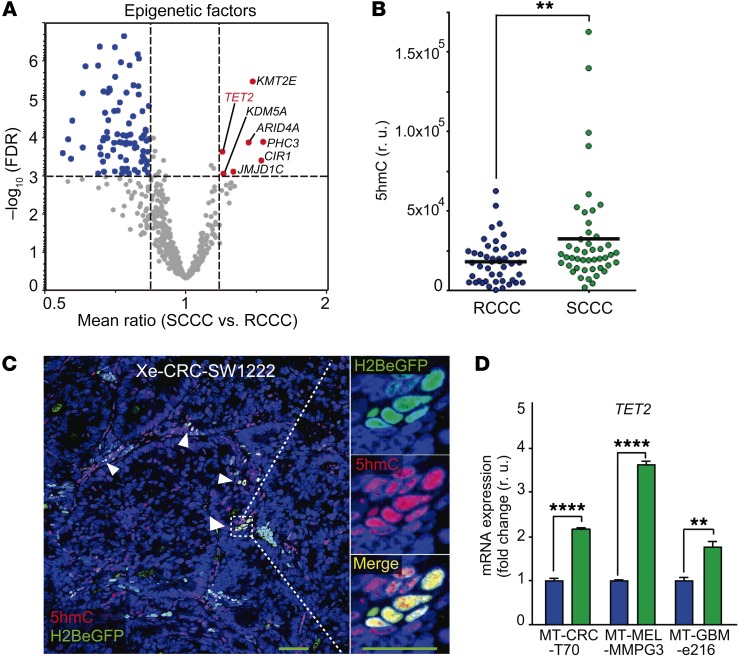
Figure 6. SCCCs present high TET2 expression and 5hmC.
(A) Evaluation of differential expression of epigenetic factors in SCCCs versus RCCCs was analyzed by microarrays integrating the data from all cancer models. Volcano plot shows epigenetic factors differentially expressed in SCCCs versus RCCCs (x axis) against their significance (false discovery rate [FDR], y axis). Upregulated and downregulated epigenetic factors are indicated in red and blue, respectively. (B and C) 5hmC levels in SCCCs and RCCCs were evaluated by immunostaining in CRC-SW1222-H2BeGFP xenografts (n = 8). Forty-six images per condition were analyzed. (B) Histological quantification of 5hmC content in RCCCs and SCCCs per picture. r.u., relative units. (C) Representative picture of double 5hmC and H2BeGFP immunostaining. White arrowheads, SCCCs containing 5hmC. Scale bar: 100 μm; high-magnification scale bar: 20 μm. Hoechst was used as counterstain. (D) Expression of TET2 measured by qPCR. Data are represented as mean ± SD of triplicates from 3 independent experiments. Blue bars, RCCCs; green bars, SCCCs. (B and D) **P ≤ 0.01; ****P ≤ 0.0001, 2-tailed Student’s t test.

