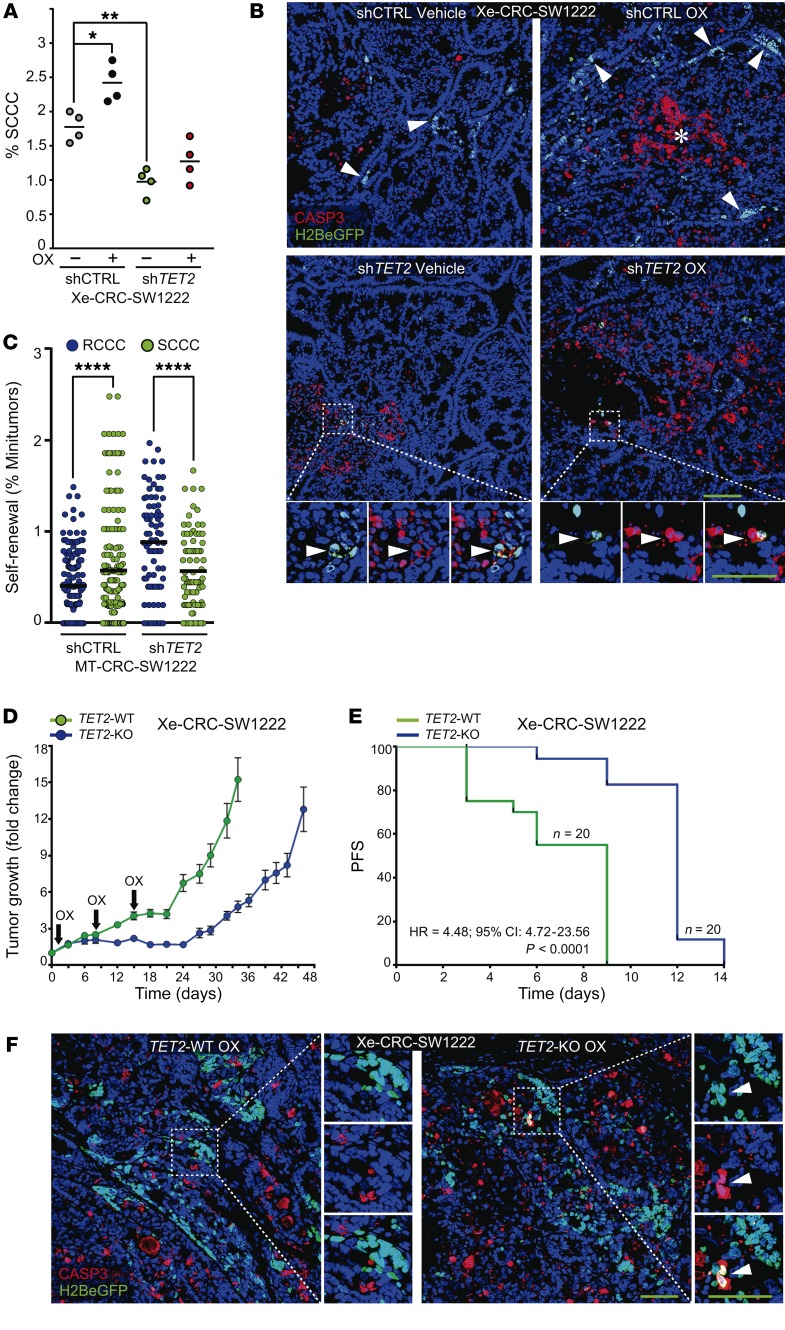
Figure 8. TET2 determines tumor recurrence.
(A and B) SCCC proportion (n = 4 xenografts per condition) (A) and apoptosis (n = 6–16 xenografts per condition) (B) were evaluated by flow cytometry (A) and caspase-3 (CASP3) immunostaining (B) in the indicated cell lines growing as xenografts in mice treated or not treated with oxaliplatin (OX). Percentage of SCCC measurements: shCTRL OX vs. shTET2 VEH (P ≤ 0.0001)/shTET2 OX (P ≤ 0.001). 1-way ANOVA. (C) MT formation capacity was evaluated for RCCCs and SCCCs isolated from the indicated cell lines. Dots indicate the percentage of MTs grown in each single well. Data are represented as mean ± SEM of triplicates from 3 independent experiments. 2-tailed Student’s t test. (D and E) Evaluation of tumor regrowth after chemotherapy treatment. (D) NOD/SCID mice with established subcutaneous TET2-WT and TET2-KO xenografts were treated with OX. The animals received a total of 3 doses and were maintained for post-treatment observation. Each point represents the mean ± SEM of 20 xenografts. (E) The survival curve represents progression-free survival (PFS) percentages showing the impact of OX on the regrowth of TET2-WT or -KO xenografts. A 20% increase in tumor volume after treatment release was considered as regrowth or progression. Significance was calculated using the log-rank (Mantel-Cox) test. HR, hazard ratio; log-rank P value. (F) Representative pictures of SCCC apoptosis evaluated by CASP3 immunostaining in indicated xenografts. (B and F) Scale bars: 100 μm; high-magnification scale bars: 20 μm. Hoechst was used as nuclei counterstain. White arrowheads, SCCCs. (A and C) *P ≤ 0.05; **P ≤ 0.01; ****P ≤ 0.0001.

