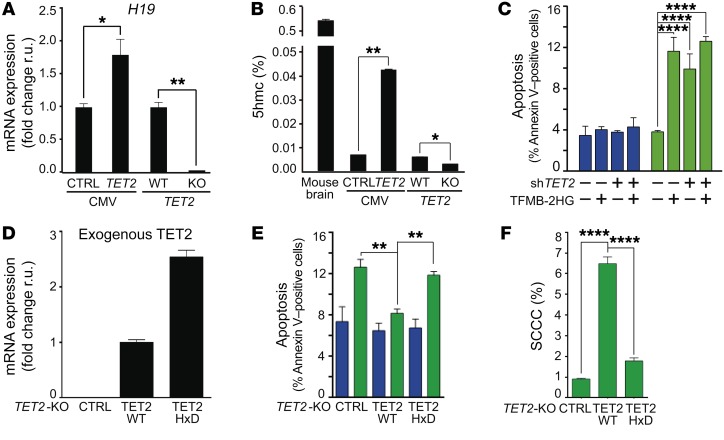
Figure 9. SCCC survival depends on TET2 enzymatic activity.
(A) Expression of H19 gene measured by qPCR. (B) Percentage of 5hmC in total genomic DNA from mouse brain or the indicated cell lines. (C) Evaluation of apoptosis by flow cytometry in RCCCs and SCCCs after cell-permeable 2-hydroxyglutarate (TFMB-2HG) exposure. Apoptosis measurements: shCTRL/shTET2 RCCC VEH/TFMB-2HG vs. shCTRL SCCC TFMB-2HG (P ≤ 0.0001); shCTRL/shTET2 RCCC VEH/TFMB-2HG vs. shTET2 SCCC VEH/TFMB-2HG (P ≤ 0.0001); shCTRL SCCC VEH vs. shCTRL/shTET2 SCCC TFMB-2HG (P ≤ 0.0001); shCTRL SCCC VEH vs. shTET2 SCCC VEH (P ≤ 0.0001); shTET2 SCCC VEH vs. shTET2 SCCC TFMB-2HG (P ≤ 0.01). (D) Expression of exogenous TET2 (TET2-WT or -HxD FLAG-tagged) was evaluated by qPCR in the indicated cell lines. Specific primers for TET2 (forward) and FLAG (reverse) were used. (E and F) Analysis of apoptosis (E) and proportion of SCCCs (F) was performed by flow cytometry in the indicated cell lines. Apoptosis measurements: TET2-KO RCCC vs. TET2-KO SCCC (P ≤ 0.001); TET2-KO/-HxD RCCC vs. TET2-HxD SCCC (P ≤ 0.01); TET2-KO SCCC vs. TET2-WT/-HxD RCCC (P ≤ 0.001); TET2-WT RCCC vs. TET2-HxD SCCC (P ≤ 0.001). (C, E, and F) Blue bars, RCCCs; green bars, SCCCs. (A–F) Data are represented as mean ± SEM (B, C, E, and F) or ± SD (A and D) of triplicates from 3 independent experiments. (A and B) 2-tailed Student’s t test. (C, E, and F) 1-way ANOVA. (A–C, E, and F) *P ≤ 0.05; **P ≤ 0.01; ****P ≤ 0.0001. All analyses were performed in the indicated SW1222-H2BeGFP cell lines growing as MTs.

