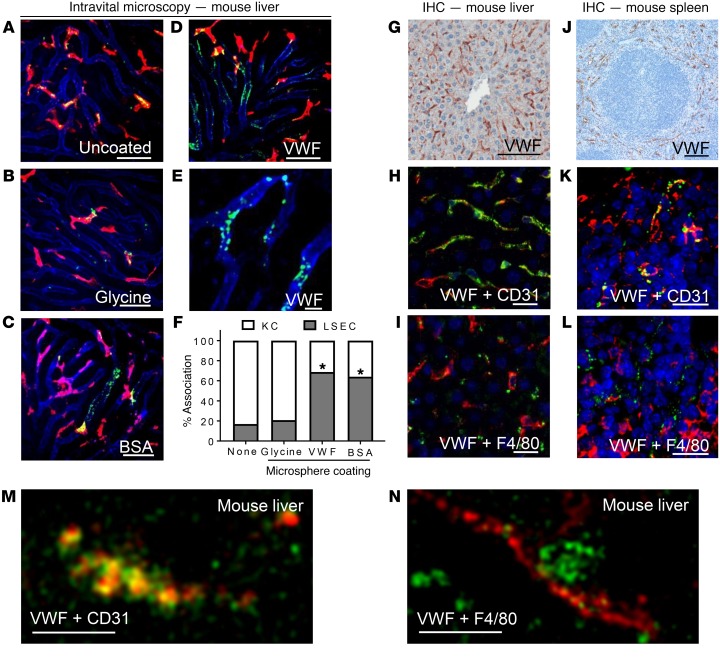
Figure 1. In vivo uptake of VWF by endothelial cells in the murine liver and spleen.
Association of coated fluorescent microspheres (green) with LSECs (anti-CD31, blue) and Kupffer cells (KCs) (anti-F4/80, red) was visualized in real time with spinning disc confocal microscopy. (A–E) Intravital fluorescent images of uncoated microspheres (A), glycine-coated microspheres (B), BSA-coated microspheres (C), and VWF-coated microspheres (D and E). Scale bars: 50 μm. Images are representative of n = 3–5 independent experiments. (F) Quantitative analysis was performed on multiple still images from n = 3–4 independent experiments ± SEM by t test; *P < 0.05. See Supplemental Figures 1 and 2 and Supplemental Videos 1 and 2 for characterization of coated microspheres. (G–N) VWF-KO mice were infused with human pdVWF for 30 minutes, and visualization of VWF localization in the liver and spleen was performed with IHC and immunofluorescence (IF). Images are representative of n = 3 independent experiments. (G) Association of human pdVWF with cells in the murine liver using IHC (scale bar: 100 μm). (H) Association of LSECs (CD31, red) and VWF (green) by IF (scale bar: 20 μm). (I) Association of human pdVWF (green) with KCs (F4/80, red) by IF (scale bar: 20 μm). (J) Association of human pdVWF with cells in the murine spleen using IHC (scale bar: 200 μm). (K) Association of splenic endothelial cells (CD31, red) and VWF (green) by IHC (scale bar: 20 μm). (L) Association of human pdVWF (green) with KCs (F4/80, red) by IHC. (M and N) Super-resolution imaging of VWF associating with CD31 (M) and F4/80 (N) (scale bars: 2.5 μm) in the liver. Images are representative of n = 3 independent experiments. For all images, blue indicates DAPI.

