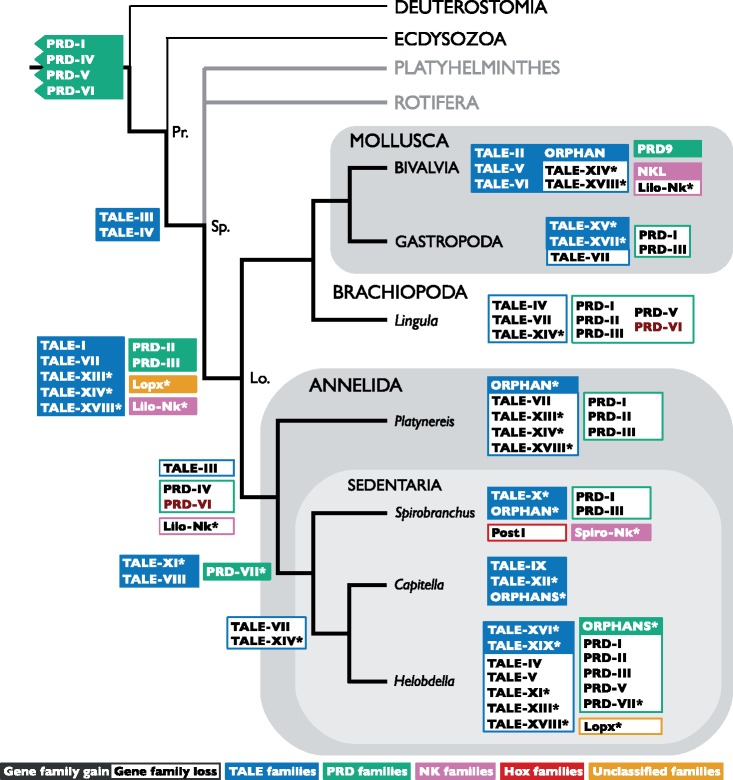
Fig. 8.
—Cladogram of the Bilateria, focusing on the annelids, summarizing the minimum gene family gain and loss events necessary to explain the pattern of gene presence and absence in the species surveyed, for TALE class genes (blue), PRD class genes (green), Nkx genes (pink), Hox genes (red), and unclassified genes (orange). White text on a colored background indicates a putative gene gain event; black text on a white background with a colored border indicates a putative gene loss event. The only gain or loss event influenced by the internal topology of the Lophotrochozoa is marked in dark red (PRD-VI). New gene families suggested herein are marked with an asterisk. Clades not sampled in these analyses are marked with grey lines. Clades from which sequences were included but not extensively surveyed in our work and with severely limited taxonomic sampling are marked by a thin black line. The Protostomia, Spiralia, and Lophotrochozoa clade nodes are marked Pr., Sp., and Lo., respectively. The topology of the cladogram is adapted from data in Weigert et al. (2014) and Luo et al. (2018), and the position of some gain/loss events from Paps et al. (2015). Clades not sampled here or in Paps et al. (including Phoronida, Nemertea, Entoprocta, and Gastrotricha) have been omitted to aid comparison with Paps et al. figure 4. For collapsed clades with more than one sampled species (i.e., Bivalvia and Gastropoda), gene gains are marked if they have been found in any of the species in that group, but gene losses marked only if they have not been identified in any. Changes to canonical families are only marked for S. lamarcki.

