
Figure 1.
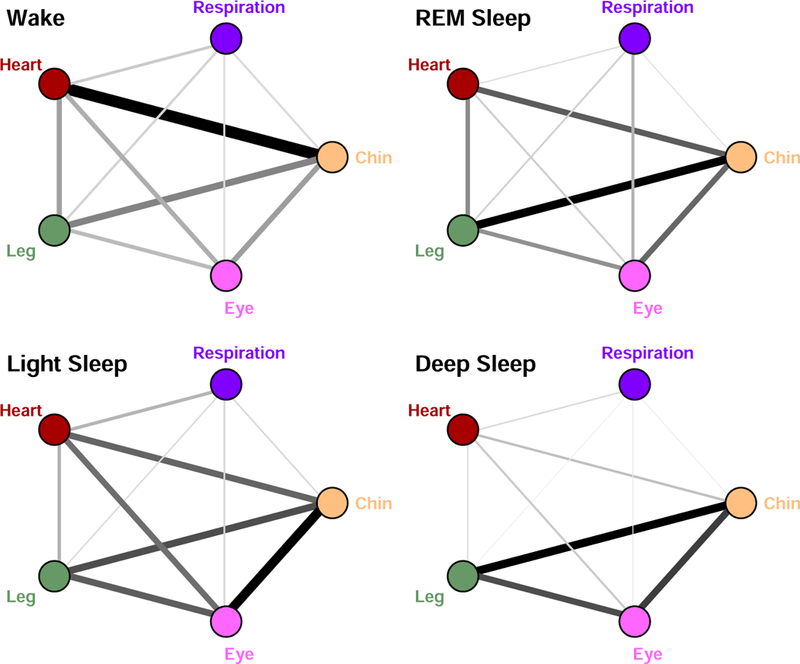
Network of interactions between key organ systems and transitions across different physiologic states. Interactions between organ systems are represented by weighted undirected graphs, where links reflect the strength of dynamic coupling as measured by the stability in the time delay between bursts of activities in the systems output signals (% TDS, see Methods). Darker and thicker links correspond to stronger coupling and higher time delay stability. Results are obtained from 8-hour recordings during sleep by weighted averaging over all segments of different sleep stages pooled from 36 healthy subjects. A pronounced re-organization in the configuration of network links strength is observed with transitions from one sleep stage to another, demonstrating a clear association between network structure and physiologic function.