
Figure 2.
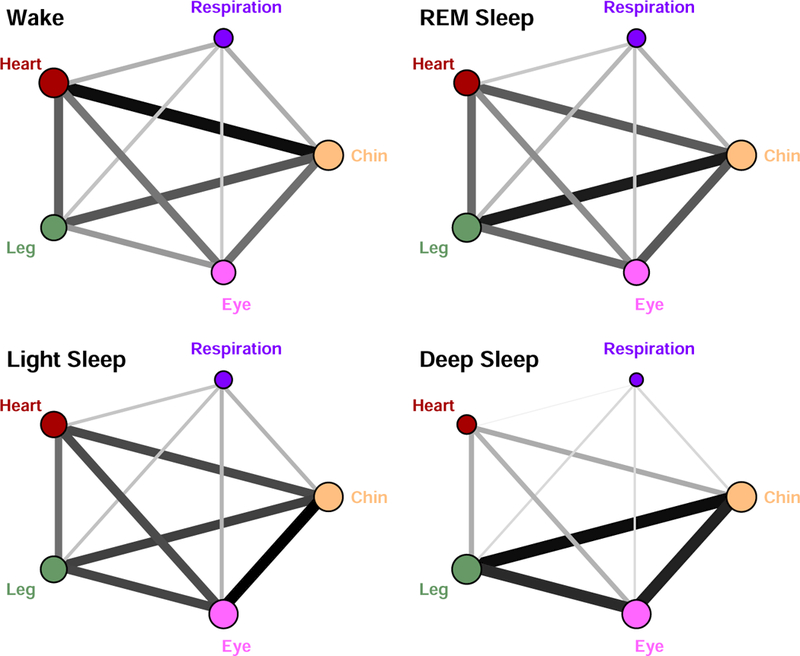
Weighted undirected graphs represent the major component of the networks of organ systems interactions for different physiologic states. The relative contribution of each organ system to the global network dynamics is presented by the size of each network node — the radius of each network node i is proportional to the component of the eigenvector V n corresponding to the largest eigenvalue λn of the original TDS network for each physiologic state (Fig.1). Links strength (indicated by different line thickness) is proportional to the off-diagonal elements of the major component of the original TDS networks in Fig.1 (see Methods). Graphs show a gradual decrease of the role of heart and respiration in the physiologic network dynamics with transition from wake to REM, to light and deep sleep, while in contrast, the relative contribution of leg and chin muscle tone and eye movement increases.