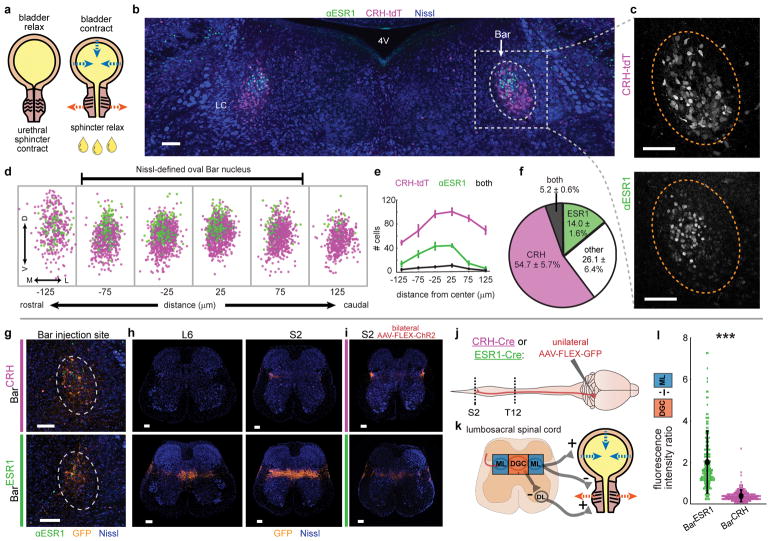
Fig. 1. A novel cell type in Barrington’s nucleus with projections biased to sphincter-inhibiting interneurons.
a, Urination requires sphincter relaxation. b, ESR1-immunostaining in Bar (dotted oval) in CRH-tdT mouse. LC = locus coeruleus, 4V = 4th ventricle. c, Larger view of CRH-tdT (top) and αESR1 (bottom) channels from (b). d, Rostrocaudal overlay of αESR1 cells (green) in Bar registered to centroid of CRH-tdT cells (magenta). e, Cell counts, and f, cell percentages in Bar (mean ± s.e.m., n=6 mice). g, GFP expression at Bar injection site in CRH-Cre (top) or ESR1-Cre (bottom) individuals. h, Axonal projections in lumbosacral spinal cord (right L6, left S2) for injections in (g). i, Axonal projections in lumbosacral S2 spinal cord for injection sites in Fig. 3b. j, Schematic for identifying Bar cell type axonal projections to spinal cord. k, Simplified urinary circuitry in the lumbosacral spinal cord. ML = mediolateral column, DGC = dorsal grey commissure, DL = dorsolateral nucleus. l, Quantification of BarESR1 and BarCRH axonal projections in lumbosacral spinal cord. Points are individual sections, thick black line is mean ± s.e.m for BarCRH (magenta, n=10 mice), BarESR1 (green, n=10 mice). Scale bars = 100 μm. ***p=0.00018 (Mann-Whitney U test).

