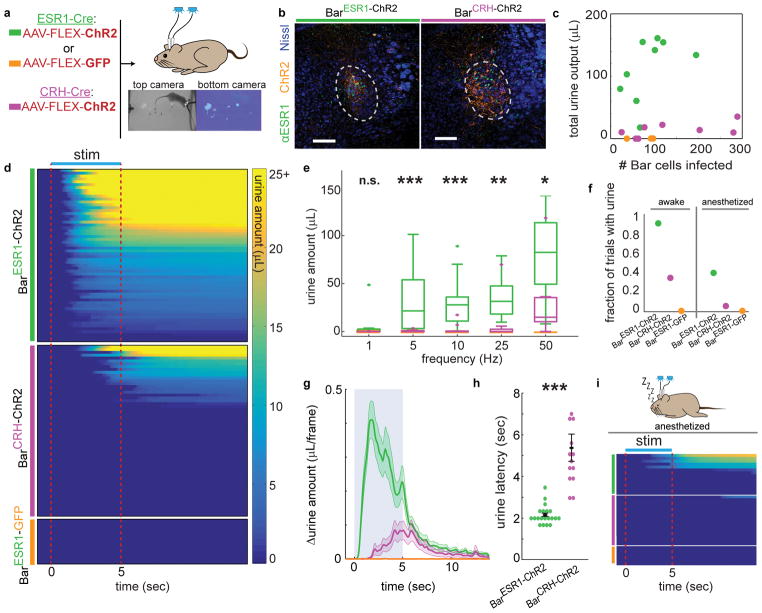
Fig. 3. Photostimulation of BarESR1 neurons induces efficient urination in awake and anesthetized animals.
a, Schematic of optogenetic stimulation and example urine detection. b, Example ChR2 expression in ESR1-Cre (left) or CRH-Cre (right) individuals. c, Total urine output across all trials for each individual versus ChR2 expression. d, Heatmap of urine output following awake photostimulation for all trials >10Hz (n=10 BarESR1-ChR2, 10 BarCRH-ChR2, 3 BarESR1-GFP mice), sorted by decreasing total urine amount. e, Urine amounts at different photostimulation frequencies: boxplots show median, 25th/75th quartiles, 1.5x interquartile ranges, and outlier dots outside these ranges (n=20 trials from 10 mice, p=0.42, 0.00049, 0.00096, 0.0021, 0.011 for 1, 5, 10, 25, 50 Hz, Mann-Whitney U test for BarESR1-ChR2 compared to BarCRH-ChR2 at each frequency). Quartile range boxes are condensed at zero when most trials do not have any urine. f, Fraction of trials with photostimulated urine detected in panels (d), awake, and (i), anesthetized. g, Δurine amount around 50 Hz photostimulation (blue shading; same mice as panel d; thick line and shading are mean ± s.e.m, n=20 trials from 10 mice). h, Urination latency after 50 Hz photostimulation (same trials as panel g), mean ± s.e.m, p=1.7E-6, Mann-Whitney U test. i, Heatmap of urine output around anesthetized photostimulation for all trials (n=7 BarESR1-ChR2, 8 BarCRH-ChR2, 3 BarESR1-GFP mice). Scale bars = 100 μm. Colors for all panels: green = BarESR1- ChR2, magenta = BarCRH-ChR2, orange = BarESR1- GFP.

