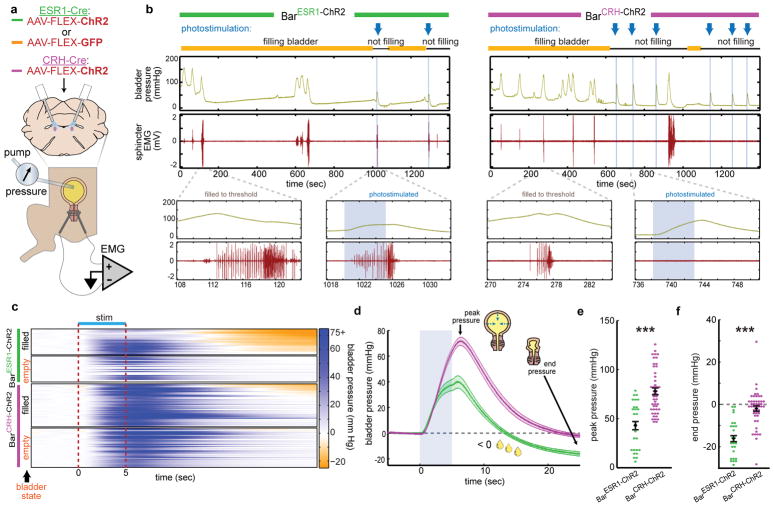
Fig. 4. BarESR1 neurons facilitate urine release during cystometry.
a, Schematic for optogenetic Bar stimulation during cystometry. b, Representative raw bladder pressure and EUS EMG traces for BarESR1-ChR2 (left) and BarCRH-ChR2 (right) individuals. Blue arrows and shading indicate photostimulation times, and yellow/black lines denote cystometry pump on/off. Top traces are 20 minutes; bottom traces show 15 second detail when the bladder is filled to threshold (no photostimulation) versus when Bar is photostimulated (blue shading). c, Heatmap of bladder pressure, sorted by increasing end pressure (decreasing urine release), around photostimulation for both filled and empty bladder trials (n=3 BarESR1-ChR2, top, and 5 BarCRH-ChR2, bottom, mice). d, Bladder pressure for ‘filled’ bladder data in panel (c), showing peak and end pressure where negative pressure indicates urine release (thick line and shading are mean ± s.e.m., green = BarESR1- ChR2, magenta = BarCRH-ChR2). e, Peak and f, end bladder pressure from (d), mean ± s.e.m,p=6.8E-6 and p=4.7E-8, respectively (Mann-Whitney U test).

