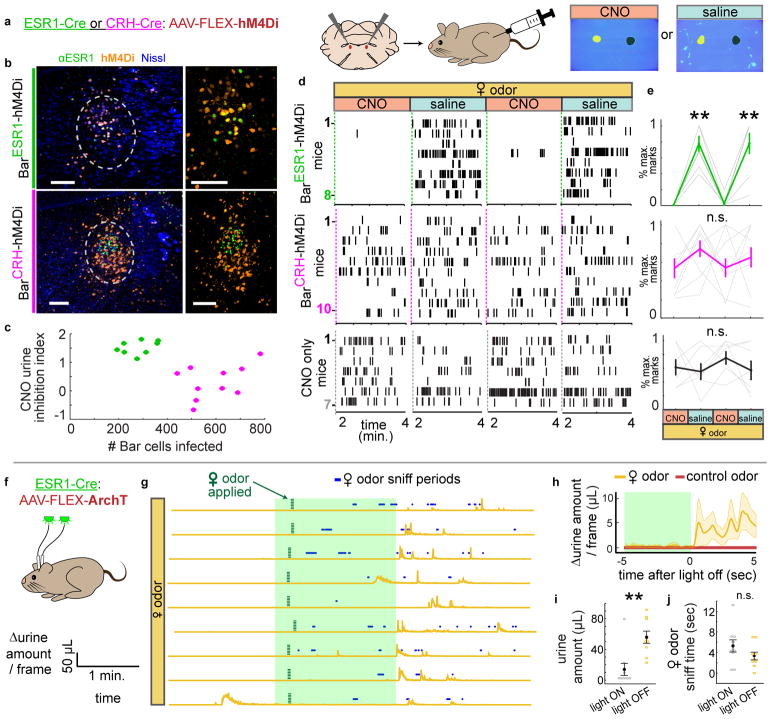
Fig. 7. Chemogenetic and optogenetic inhibition of BarESR1 neurons impairs voluntary scent marking urination.
a, Schematic of chemogenetic inhibition of Bar during scent marking urination. b, Example hM4Di expression in Bar of ESR1-Cre, top, and CRH-Cre, bottom, mice; larger views minus Nissl on the right. c, Number of Bar cells infected with hM4Di virus versus CNO urine inhibition index (see Methods) for all mice (green for ESR1-Cre, magenta for CRH-Cre). d, Raster plots of urine marks on consecutive days with either CNO or saline (BarESR1-hM4Di, top, BarCRH-hM4Di, middle, CNO-only control, bottom). e, Percentage of maximum urine marks across all CNO or saline days for, top, BarESR1-hM4Di (n=8, p=0.00013 Friedman’s test, **day 2 saline p=0.0058, day 4 saline p=0.011 Dunn-Sidak posthoc differences from CNO days 1 & 3, middle, BarCRH-hM4Di (n=10, p=0.29 Friedman’s test) and, bottom, CNO control (n=7, p=0.86 Friedman’s test) mice (thin lines individual mice, thick lines mean ± s.e.m.). f, Schematic of optogenetic inhibition of BarESR1 during scent marking urination. g, Δurine amount around 2 min. photoinhibition period. Female odor presented within 15 seconds of light on, and subsequent sniff periods shown in blue. n=9 trials from 3 mice. h, Δurine amount ± 5 sec. from end of photoinhibition for control odor and female odor (thick line and shading are mean ± s.e.m., n=9 total trials from 3 mice). i, Urine amount (**p=0.0039), and, j, female odor sniff time (p=0.20) during 2 min. photoinhibition period and 2 min. immediately following (mean ± s.e.m., same trials as h, Wilcoxon signed rank tests). Green shading denotes photoinhibition periods. Scale bars = 100 μm.

