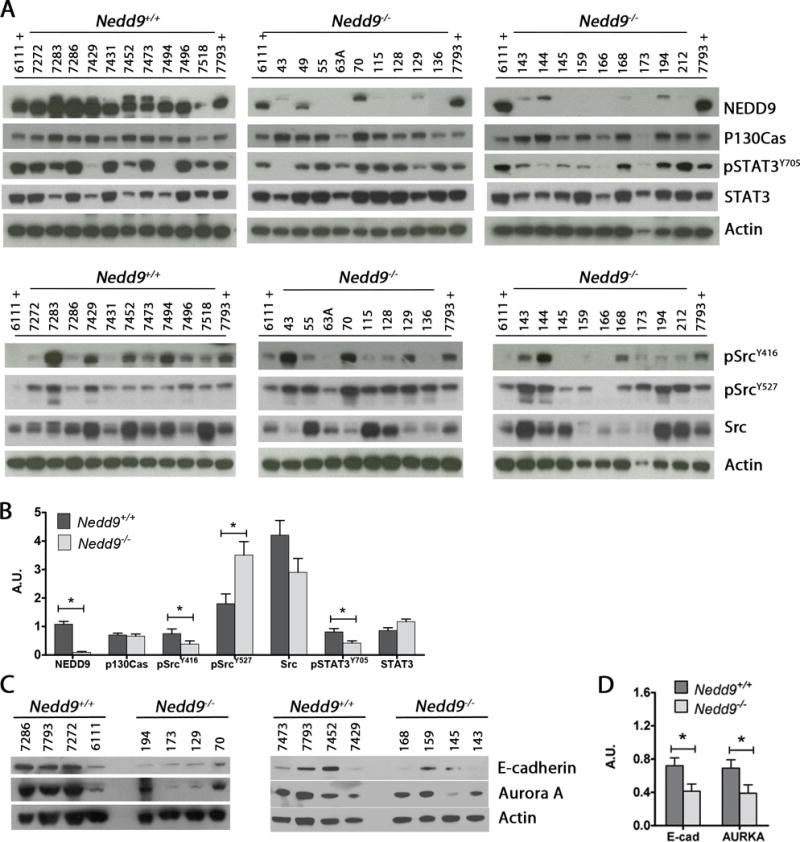
Figure 2. Expression and activation of oncogenic signaling in Nedd9 wild type and null ovarian tumors.

A) Western blot analysis of snap frozen tumor tissue lysates shows the level of expression and/or activation of indicated oncogenic proteins. Samples labeled with ‘+’ are reference specimens loaded on all gels for cross comparison. B) Densitometric analysis of the representative immunoblot images to show NEDD9 (upper band on the NEDD9 blot is non-specific), Src, pSRC, STAT3, pSTAT3, E-Cadherin and AURKA levels relative to β-actin. Representative western blots from 3 experiments (arbitrary number of samples). Densitometric analysis was performed using Image J and analyzed by the nonparametric two-tailed Wilcoxon-Mann-Whitney test. Bars labeled with asterisks are statistically significant (*P<0.05) and results are summarized as mean ± s.e.m.
