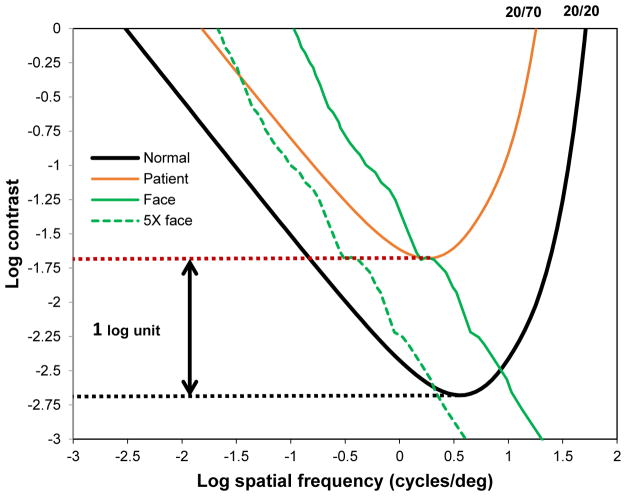
Figure 2.
Log contrast threshold vs log spatial frequency for a normally sighted person (black curve) and a low vision patient (red curve). The area within the red curve represents contrasts that are visible to the patient. The area within the black curve are contrasts visible to a normally sighted person.

