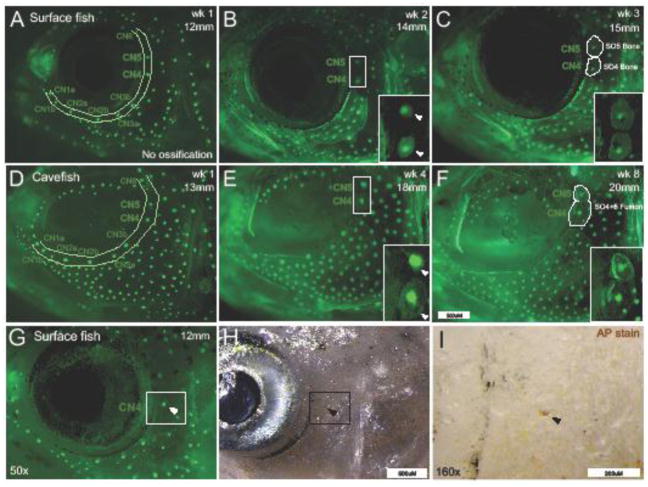
Figure 1. Canal neuromast positioning corresponds with suborbital bone ossification centers.
During the first week of imaging (wk 1) of imaging with DASPEI and calcein (12mm SL, 8 wpf), surface fish (A) display a complete canal neuromast (CN) chain, but the SO4 and SO5 bones cannot yet be detected with calcein staining. One week later (14mm SL, 9wpf) within the same surface fish individual, bony matrix condensations form around CN4 and CN5 (positive calcein staining indicated by white arrowheads). At week 3 (15mm, 10wpf), the SO4 and SO5 bones are visible with CN4 and CN5 residing at the center of the bony matrix. Cavefish at the same stage (13mm SL, 9 wpf) also have a complete CN chain before ossification is detected by calcein staining (B). Cavefish suborbital bones ossify at a slower rate compared to surface fish. By week 4 (18mm SL, 13 wpf) in the same cavefish individual, ossification centers formed around CN4 and CN5 (white arrowheads). By week 8 (20mm SL, 17wpf), SO4 and SO5 bones fused together with both CN4 and CN5 fixed within the bony matrix. Alkaline Phosphatase (AP) staining (black arrowheads) revealed that CN positioning serves as a marker location for early osteoblast activity (C). Images in A and B were captured at 35x magnification and the white scale bar represents 500μm. Images in C were captured at 50x and 160x with scale bars representing 500μm and 200μm, respectively.

