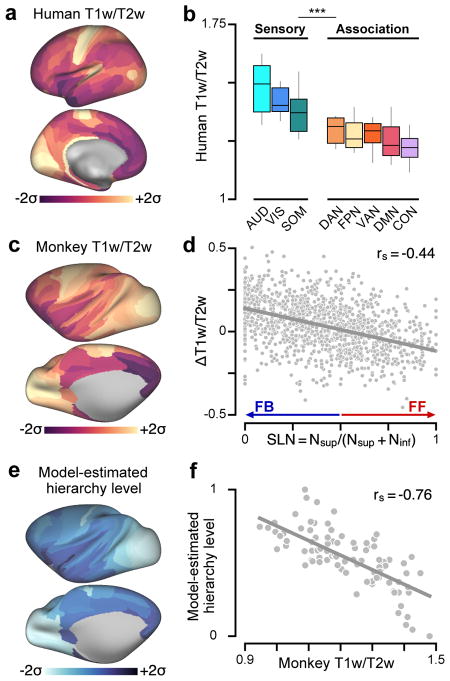
Figure 1.
T1w/T2w neuroimaging maps noninvasively capture the hierarchical organization of primate cortex. (a) The parcellated group-averaged (N=339) human T1w/T2w map exhibits high values in primary sensory cortical areas relative to association areas. (b) Human T1w/T2w map values are significantly lower in functionally defined association networks than in sensory networks (P < 10−5; two-sided Wilcoxon signed-rank test on N=6608 paired differences) (Supplementary Fig. 1c, d). Box plots mark the median and inner quartile ranges for areas in each network, and whiskers indicate the 95% confidence interval. (c) The parcellated group-averaged (N=19) macaque monkey T1w/T2w map topography is similar to that of the human. (d) Interareal variation in the T1w/T2w map correlates with the laminar specificity of directed feedforward (FF) and feedback (FB) projections in monkey cortex, as quantified by the fraction of labeled supragranular layer neurons (SLN) in the source area. High and low SLN correspond to FF and FB projection motifs, respectively. SLN significantly correlates with pairwise difference (target minus source) in areal T1w/T2w map values across N=1243 directed projections (rs = −0.44, P < 10−5; Spearman rank correlation). (e) Anatomical hierarchy levels across cortical areas are estimated by fitting a generalized linear model to predict projections’ SLNs as a function of pairwise hierarchical distance. (f) Model-estimated anatomical hierarchy levels are highly anti-correlated with T1w/T2w map values across N=89 areas of monkey cortex (rs = −0.76, P < 10−5). T1w/T2w map values and model-estimated hierarchy levels in panels a, c, and e are standardized (i.e., z-scored) and shown in units of standard deviations (σ) from the mean.

