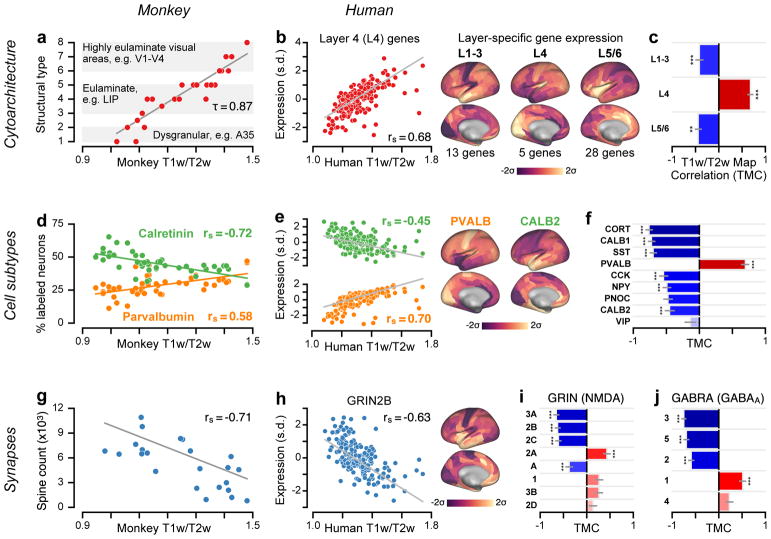
Figure 4.
Group-averaged T1w/T2w maps capture specialization of cortical microcircuitry in humans and nonhuman primates. (a) Cortical cytoarchitectural type is very strongly correlated with the macaque monkey T1w/T2w map across N=29 areas (τ = 0.87; P < 10−5; two-sided Kendall’s tau-b correlation) (rs = 0.96; P < 10−5; Spearman rank correlation). (b) The average expression map of 5 genes preferentially expressed in human granular layer 4 (L4) is positively correlated with the human cortical T1w/T2w map (rs = 0.68; P < 10−5; Spearman rank correlation), consistent with a more prominent granular L4 in sensory than association cortex. Expression is plotted in units of standard deviations (s.d.; σ) from the mean. (c) Average expression maps of laminar-specific genes show significant T1w/T2w map correlations (TMCs). L1–3: supragranular layers 1–3 (rs = −0.42; P < 10−5); L5/6: infragranular layers 5 and 6 (rs = −0.44; P = 2.49 * 10−3). (d) The T1w/T2w map captures areal variation in the relative proportions of calretinin- (rs = −0.72; P < 10−5) and parvalbumin-expressing (rs = 0.58; P = 1.7 * 10−5) inhibitory interneurons across N=47 areas of monkey cortex. (e) Genes coding for calretinin (CALB2; rs = −0.45; P < 10−5) and parvalbumin (PVALB; rs = 0.70; P < 10−5) exhibit homologous hierarchical gradients in human cortex. (f) TMCs of genes coding for markers of specific inhibitory interneuron cell types. (g) Basal-dendritic spine counts on pyramidal cells are significantly anti-correlated with the monkey T1w/T2w map across N=23 areas (rs = −0.71; P = 1.6 * 10−4). (h) The gene coding for the NMDA receptor subunit NR2B (GRIN2B) exhibits a negative TMC (rs = −0.63; P < 10−5). (i, j) TMCs of genes coding for distinct subunits of the excitatory NMDA receptor and inhibitory GABAA receptor. For comparison with monkey measurements in panels a, d, and g, Spearman rank correlations with model-estimated hierarchy levels (instead of T1w/T2w map values) were −0.92 for cytoarchitectural type; 0.72 (−0.77) for relative calretinin (parvalbumin) expressing interneuron proportion; and 0.78 for spine count. Statistical significance in panels c, f, i, and j is calculated using a spatial autoregressive model to account for spatial autocorrelation, Bonferroni-corrected by the number of genes in each set (*, P < 0.05; **, P < 10−2; ***, P < 10−3), and grey lines mark the jackknife estimate of standard error (see Methods).

