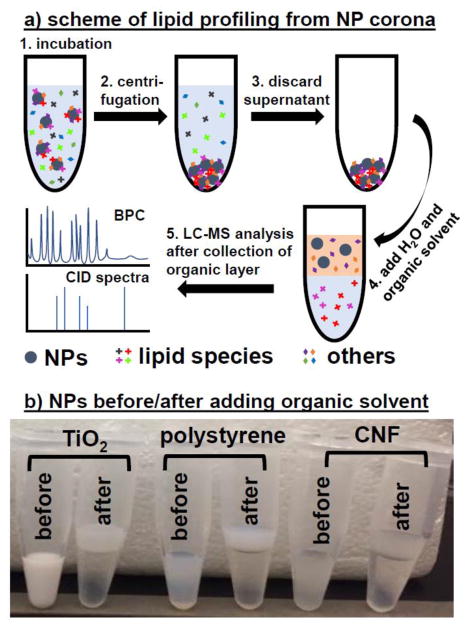
Figure 1.
(A) Schematic of lipid extraction and analysis process, including collection of NPs incubated with the biological sample, extraction of lipids binding to the NP surface, and analysis of the extracted lipids by LC-MS/MS. (B) Appearance change of TiO2, PS and CNF NPs before and after being mixed with chloroform.

