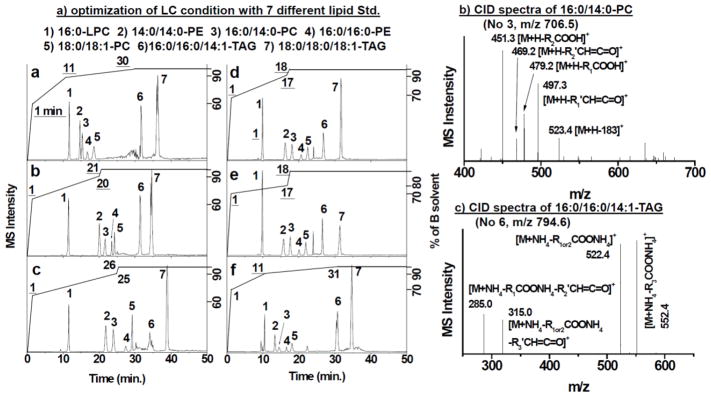
Figure 2.
(A) Base peak chromatograms (BPC) of 7 lipid species under 6 (a – f) different solvent gradients. The Y-axis on the right side represents the percentage of solvent B (%B) in the gradient elution program; the underlined numbers on the BPC are the time point at which %B reached to the value on X-axis; and the numbers without underlines depict each lipid species. (B) and (C) are the specific CID fragment patterns of PC and TAG, respectively.

