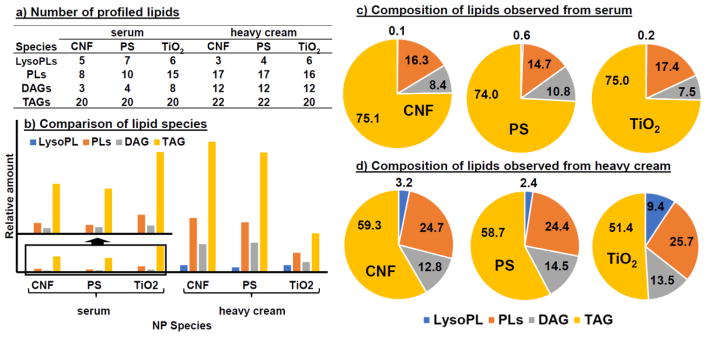
Figure 5.
Comparison of the lipid adsorption profiles among NPs when incubated with serum and heavy cream. The profile on each NP in the matrix is represented in three ways: (A) numbers of identified lipids within each lipid category (LysoPLs, PLs, DAG and TAG); (B) the sum relative amounts of all lipid species belonging to each lipid category; and (C) the percentage of each lipid category among all lipids adsorbed by the NPs, calculated by dividing the sum relative amount of each lipid category by the sum relative amount of all four lipid categories considered in the present work.

