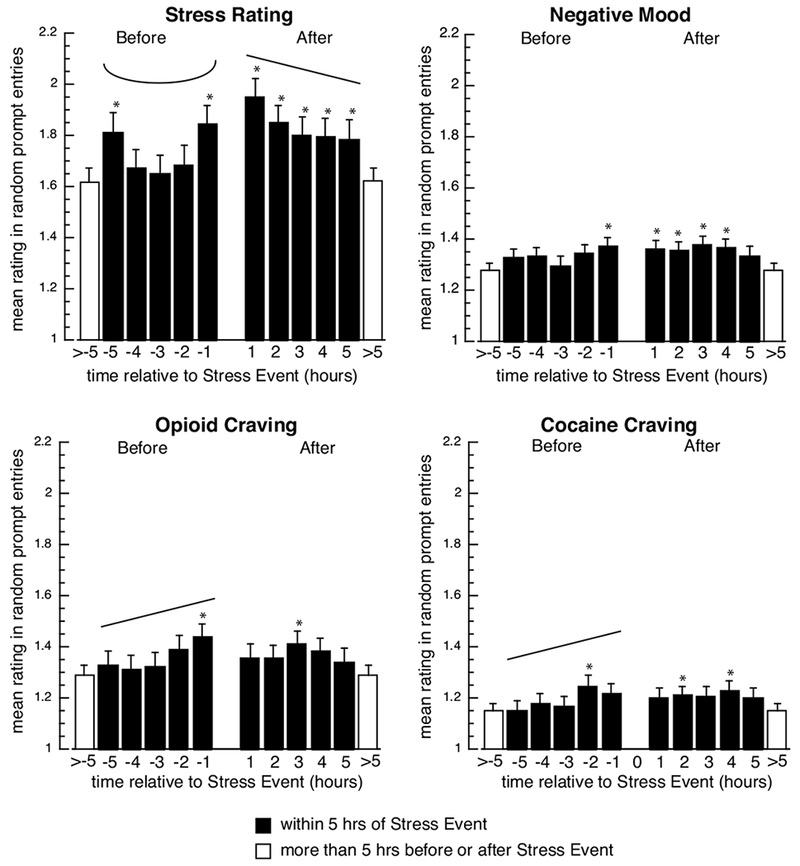
Fig. 2.

Model-predicted mean random-prompt ratings of stress, negative mood, opioid craving, and cocaine craving in the 5 hours before and after stress events. Filled bars show data for one-hour intervals before (−5 to −1) and after (1 to 5) a stress event; open bars show “base levels” (means for all random prompts not occurring with 5 hours of a drug entry or a stress-event entry). Asterisks indicate significant differences (p<.05) between the marked bar and the base level (open bars), based on Tukey-adjusted pairwise comparisons. Significant linear increases or decreases are indicated by straight angled lines, and significant quadratic effects are indicated by u-shaped lines; degrees of freedom, F-values, and p values are shown in Table 2.
