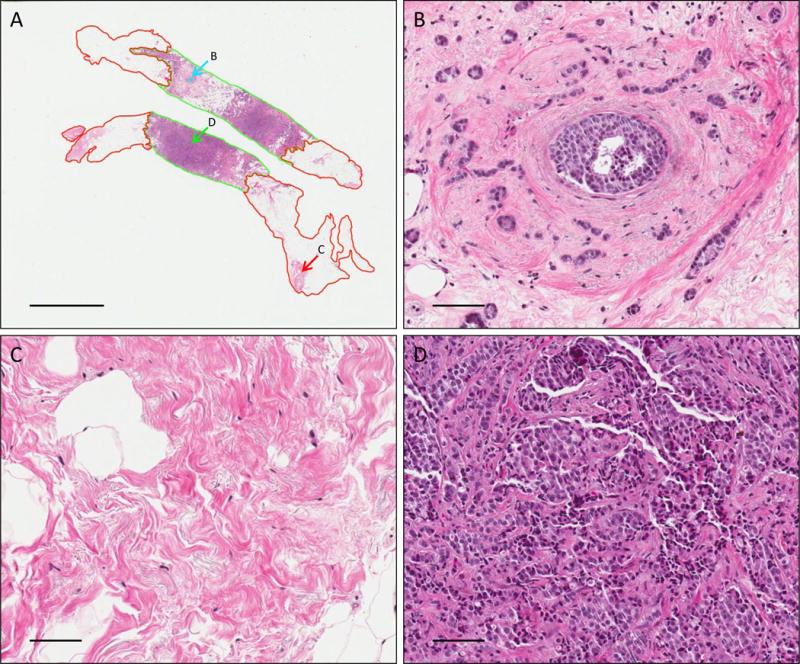
Figure 1.

Representative images of H&E stained IDCA with DCIS breast cancer section showing overall view of the core needle biopsy (A), DCIS tumor area (B), non-tumor tissue area (C) and tumor tissue area (D). Magnification panels and scale bar shown at (A) are 0.6X and 4mm and (B–D) are 20X and 100um. Green represents tumor area, red represents stroma area and cyan represents DCIS area.
