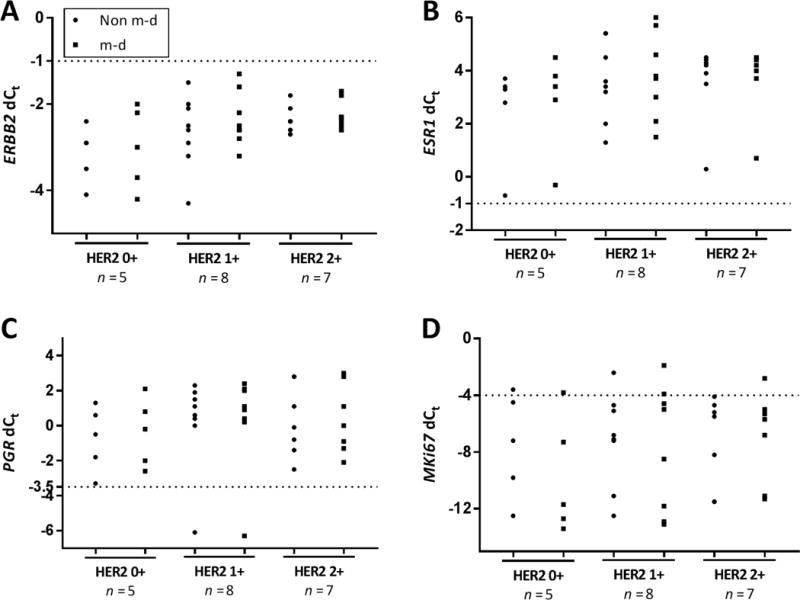
Figure 5. Comparison between pathologist determined IHC/FISH and RT-qPCR for non m-d versus m-d samples in IDCA with DCIS cohort.

Dot plot showing mRNA quantification of ERBB2 (A), ESR1 (B), PGR (C), and MKi67 (D) determined to be 0+, 1+ and 2+ by IHC and confirmed by FISH. Non m-d: not macrodissected and m-d: macrodissected.
