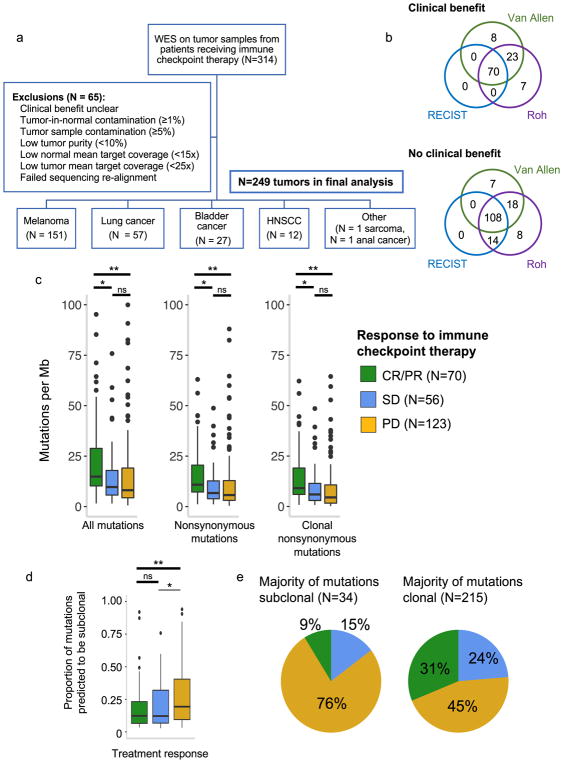
Fig. 1. Clinical cohort consolidation, response stratification, and mutational load investigation.
(a) Data quality control for 249 samples included in final analysis. (b) Comparison of three published response metrics for determining OR vs. NR. (c) Comparison of tumor mutational burden between CR/PR vs. PD (For ‘All mutations’, p=0.0005 for CR/PR vs PD, p=0.0054 for CR/PR vs SD, and p=0.434 for SD vs PD; for ‘Nonsynonymous mutations’, p=0.0003 for CR/PR vs PD, p=0.0063 for CR/PR vs SD, and p=0.3769 for SD vs PD; for ‘Clonal nonsynonymous mutations’, p=0.00005 for CR/PR vs PD, p=0.011 for CR/PR vs SD, and p=0.151 for SD vs PD). Outlying points from patients with mutations/Mb > 101 are not shown (2 CR/PR, 1 SD, 3 PD). (d) Intratumoral heterogeneity across response groups (n=249 biologically independent samples, p=0.001 for CR/PR vs. PD, p=0.5122 for CR/PR vs SD). (e) Clinical response to immune checkpoint therapy broken down by intratumoral heterogeneity. For (c, d), p-values calculated by two-sided Mann-Whitney U *p<0.05, **p<0.005, ns = not significant. Boxplots show the median, first and third quartiles, whiskers extend to 1.5 × the interquartile range, and outlying points are plotted individually.

