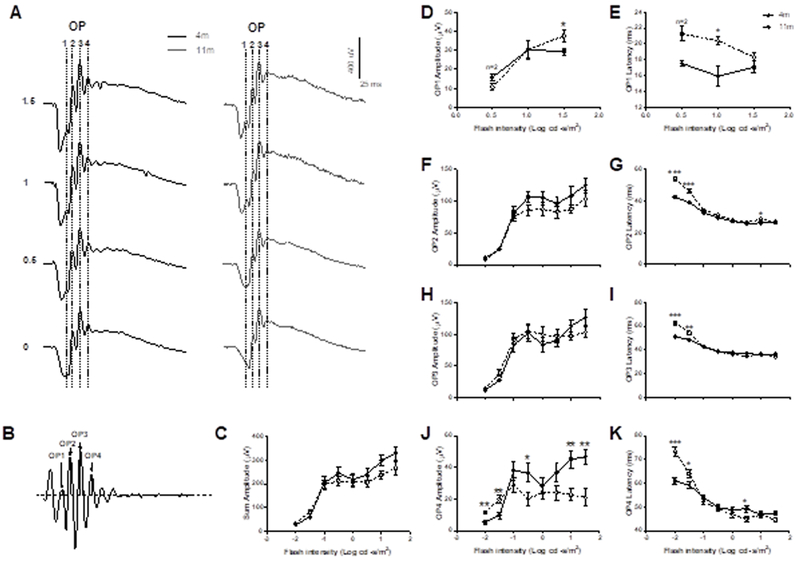
Figure 6:

Scotopic oscillatory potential amplitudes, a measure of RGC function, were analyzed with regard to latency and amplitude at 4 peaks / local maxima termed OP1–4 (A, B) and were measured from the baseline (black dashed horizontal line) to the local maximal of the positive peak (grey dotted vertical line; B). There was no significant difference in OP1–4 amplitudes between the two age groups (C), however, 11-month old DBA/2 mice showed increased amplitudes at OP1 (D), unchanged amplitudes at OP2 (F) and OP3 (H) and decreased amplitudes at OP4 (J). Latencies were slower at OP1 (E) and at lower flash intensities for OP2 (G), OP3 (I) and OP4 (K). Data are expressed as mean ± SEM.
