
Figure 7:
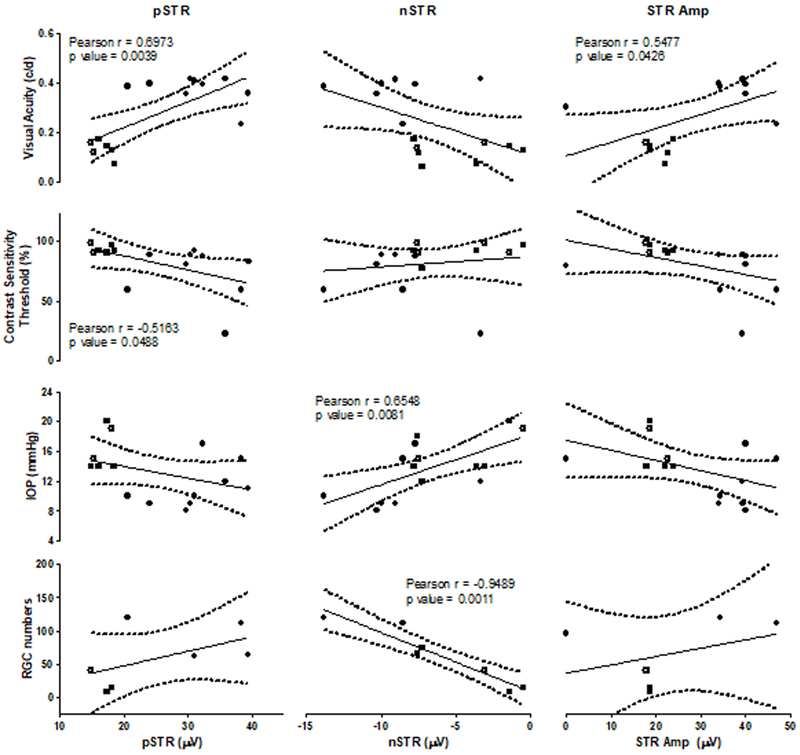
STRs recorded at a flash intensity of −4 log cd·s/m2 were correlated with Visual Acuity, Contrast Sensitivity Threshold, IOP and RGC counts, respectively. Specific Pearson product-moment correlation coefficient r and respective p-values are listed directly in panels, where significant correlations were identified.