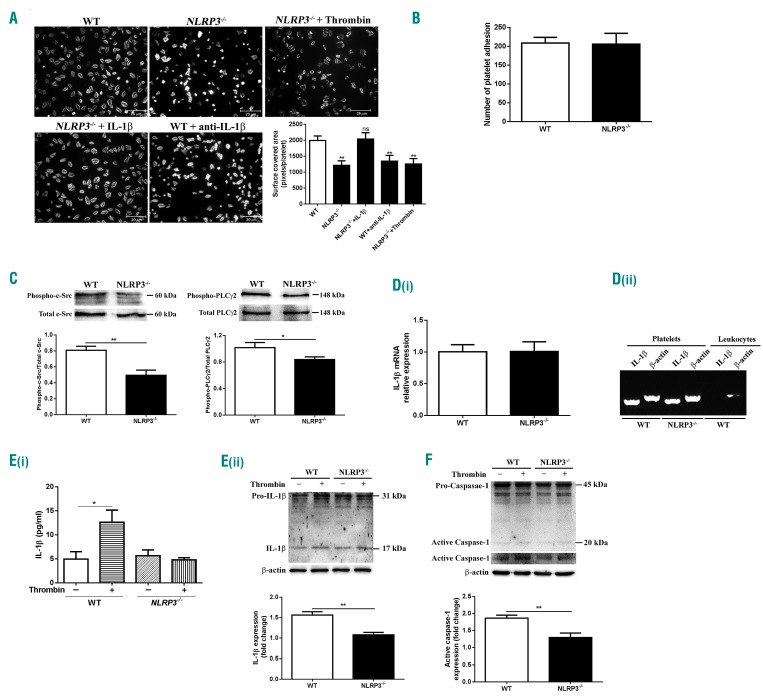
Figure 3.
Platelet spreading and interleukin-1β secretion. (A) Platelet spreading on immobilized fibrinogen in the presence or absence of 10 ng/mL IL-1β, 0.5 μg/mL anti-IL-1β or 2 U/mL thrombin. Scale bar = 20 μm. Covered area was quantified by Image J software and analyzed by one-way ANOVA for comparison. Images (X100) are representative of three independent experiments (mean ± SD, n = 3). Compared with wild-type (WT), **P<0.01; ns: not significant. (B) Platelet adhesion on fibrinogen for 90 min. The number of platelets that adhered to fibrinogen-coated glass coverslips was calculated using Image J software (mean ± SE, n = 3) (Student t-test). (C) Phosphorylation of c-Src and PLCγ2 in platelets after spreading on fibrinogen for 90 min. Data were quantified using Image J software and are represented as a ratio relative to total level (mean ± SD, n = 3) (Student t-test). *P<0.05, **P<0.01. (D) Total RNA was isolated from 5 × 10⁸/mL platelets in order to measure IL-1β mRNA expression by RT-PCR (mean ± SD, n = 3) (Student t-test) (i); Washed platelet preparations (5 × 10⁸/mL) were found to contain approximately 2 × 10⁴/mL leukocytes. RNA was isolated from 5 × 10⁸/mL platelets or 2 × 10⁴/mL leukocytes followed by reverse transcription into cDNA which was used to measure IL-1β mRNA expression by PCR. PCR products were evaluated on 1.5% agarose gel (ii). (E) Washed platelets were stimulated with 0.5 U/mL thrombin before the level of IL-1β in supernatants was measured by enzyme-linked immunosorbent assay (mean ± SE, n = 3-5) (Student t-test) (i) and western blot (mean ± SD, n = 3) (ii). (F) Active caspase-1 expression after thrombin stimulation (mean ± SD, n = 3) (Student t-test). The western blot analysis of IL-1β or active caspase-1 expression was quantified as fold change to the level without treatment. *P<0.05;**P<0.01; ***P<0.001. ns: not significant.

