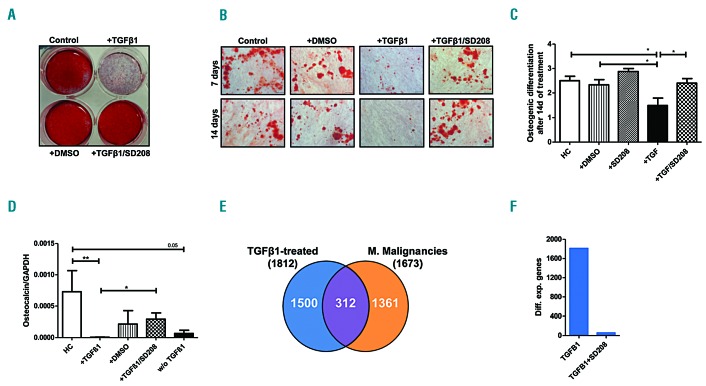
Figure 4.
Transforming growth factor β1 suppresses the osteogenic differentiation capacity of healthy mesenchymal stromal cells and induces a specific gene expression profile. Healthy MSC (n=6) were pre-incubated with TGFβ1 and/or SD-208 for up to 28 days. Medium was changed every 3 days and supplemented with TGFβ1 at a concentration ranging from 5 ng/mL to 10 ng/mL and/or SD-208 (0.25 μM to 0.5 μM). Subsequently, osteogenic differentiation was induced for 14 days and visualized by Alizarin red staining as described previously.12,13 (A) Overview of a representative experiment. (B) Representative micrographs of healthy MSC after exposure to the respective factors with scale bars indicating 100 μm. (C) For the purpose of quantification, osteogenic differentiation capacity was graded according to microscopic analysis of staining intensity as follows: 0 = absent; 1 = weak; 2 = moderate; 3 = intensive as previously described.12 (D) Messenger RNA expression of osteocalcin was measured by quantitative real-time PCR analysis of healthy MSC (n=5) after 3 days of incubation. HC: healthy control; DMSO: dimethylsulfoxide; w/o TGFβ1: healthy MSC were treated with TGFβ1 for 3 days, then the medium was changed and the MSC were cultured for 3 additional days without TGFβ1. For all experiments results are expressed as mean ± SEM. Asterisks indicate P-values *P<0.05, **P<0.01. (E) After a 28-day incubation period healthy MSC (n=2) were subjected to RNA sequencing analysis. The Venn diagram illustrates a substantial overlap of 312 genes deregulated in both the TGFβ1-treated MSC and the patient-derived MSC. (F) Bar charts demonstrate that most of the differential gene expression provoked by TGFβ1 in healthy MSC (1812 genes, q<0.05) is abrogated by SD-208 (only 58 genes remained differentially expressed, q<0.05).

