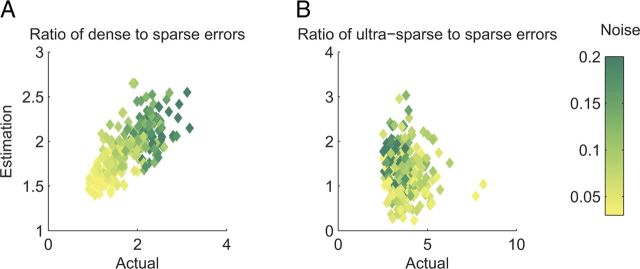
Figure 7.
Estimating error from experimentally accessible factors versus the actual error. The figure shows the ratio between the error obtained using either dense (A, f = 0.5) or ultra-sparse (B, f = 0.01) to that obtained using sparse (f = 0.1) coding. Ratios are shown for various levels of the input noise. The x-axis shows the ratio derived from the full simulation, while the y-axis is computed using the formula and calculating γ and σ2 from 30 trials of 100 RCNs. The color bar shows the noise level (same values as in Fig. 5A–C, using 64 patterns).

