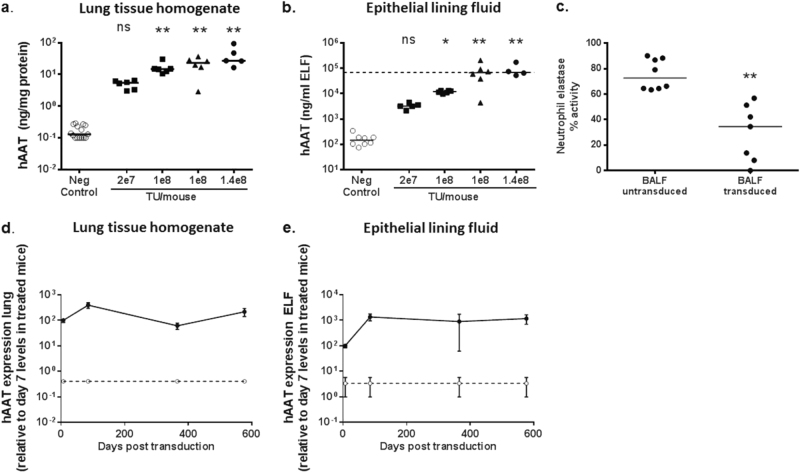
Fig. 4.
Sustained expression of α1 antitrypsin (hAAT) after lentivirus transduction. C57Bl/6 mice were transduced with rSIV.F/HN-hCEF-sohAAT (2e7–1.4e8 TU/mouse) or D-PBS (negative control) by nasal sniffing and culled ~ 10 days post transduction (n = 5–6/group). Different batches of virus were used for this experiment. Squares = virus grown in adherent culture (batch 1). Triangles = virus grown in suspension culture (batch 2). Circles = virus grown in adherent culture (batch 3). Human AAT expression was quantified in lung tissue homogenate (a) and epithelial lining fluid (ELF) (b). Each data point represents an individual animal and horizontal bars indicate the group median. The horizontal dashed line represents the therapeutic target level. Data are collated from three independent experiments performed on separate days. * = p < 0.05 and ** = p < 0.01 compared with negative control, respectively, using analysis of variance followed by a Bonferroni post hoc test. ns = not significant. Two cohorts of mice were treated with 1e8 TU/mouse because two separate batches of virus produced in either adherent or suspension culture were used (see Material and Methods). c A neutrophil elastase activity assay was performed on bronchoalveolar lavage fluid (BALF) from randomly selected mice (from Fig. 2a, b) treated with rSIV.F/HN-hCEF-sohAAT or D-PBS treated control animals. Each data point represents an individual animal, horizontal bars represent the group median. Data are expressed as % NE activity with the 'no sample assay control' set at 100%. ** = p < 0.01 compared with BALF from transduced control animals. (Kruskal–Wallis test followed by Dunn multiple comparison post hoc test). In a separate experiment, mice (n = 4–8/group) were transduced with rSIV.F/HN-hCEF-sohAAT (2e7 TU/mouse, solid line) or D-PBS (negative control, dotted line) by nasal sniffing and culled 7 days, 3, 12 and 19 months post transduction. Human AAT expression was quantified in lung tissue homogenate d and ELF e and expressed relative to day 7 levels of treated mice as a percentage of the day 7 time-point (absolute levels of AAT expression were similar to levels shown in Fig. 4a, b). Data are shown as mean ± SEM. ** = p < 0.01 compared with negative control at all time-points using analysis of variance followed by a Bonferroni post hoc test

